GMAT Data Insights (DI) was introduced in 2023 when GMAC released a new version of the GMAT exam. Your performance on the Data Insights section will account for one third of your total GMAT score. You’ll have 45 minutes to answer 20 Data Insights questions, which will involve a ton of data analysis, critical thinking, and quantitative reasoning. Note that Data Sufficiency questions, formerly under Quant, now appear on Data Insights.
When you first encounter DI question types, you might wonder just how one possibly navigates all that information. But! By preparing early and practicing a whole lot of questions, you’ll be ready to take on whatever DI throws at you on test day.
What is GMAT Data Insights?
The Data Insights section tests your quant-based and verbal-based reasoning in five parts:
- Multi-source Reasoning (10-20% of the questions)
- Table Analysis (10-20% of the questions)
- Graphics interpretation (20-30% of the questions)
- Two-part Analysis (10-20% of the questions)
- Data Sufficiency (20-40% of the questions)
Some prompt types will have multiple questions. In addition, you’ll have to answer a question before you can move on—and you can’t go back to a question once you’ve answered it.
Data Insights Question Types on the GMAT
Multi-Source Reasoning
Multi-source reasoning questions show you a split screen: on the left, you’ll have three clickable cards, each with a piece of information that will help you answer a particular question, and which you can only see one of at a time. The questions are either standard five-choice multiple choice or multiple dichotomous choice. You’ll have two answer choices (e.g. “true/false”) for each part of a three-part question.
Here are more examples of multi-source reasoning problems!
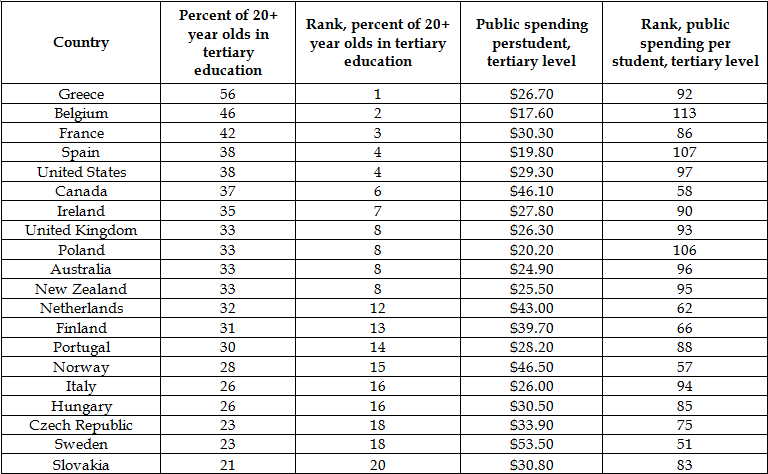
Table Analysis
Table analysis questions give you a sortable table of numbers. These are accompanied by multiple dichotomous choice questions, in which you have two answer choices (e.g. “true/false”) for each part of a three-part question.
Check out a sample table analysis problem!
Graphics Interpretation
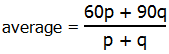
For graphics interpretation questions, you’ll receive some visual information in the form of a chart or a graph, then questions containing two drop-down menus each. These menus will have you fill in blanks within a sentence according to the data shown in the visual.
Check out a sample Graphics Interpretation question and our post for more graphics interpretation problems!
Two-part Analysis
Two-part analysis questions give you a large prompt, followed by a question-and-answer table. You will fill out the answers for each of two questions, which can vary; they may be partially or completely related, but they will always be interdependent.
Check out a sample two-part analysis problem!
Data Sufficiency
On the GMAT, the format of each Data Sufficiency problem is the same: you’re given a question and two statements. It’s up to you to decide whether the statements give you enough information to answer the question. You don’t need to give the answer to the actual question. You just have to decide whether either statement (or both statements) gives data that is sufficient for finding an answer—hence the term data sufficiency!
Furthermore, there are two kinds of data sufficiency questions: Yes/No and Value questions. You’ll see each type in the practice problems below.
Check out a sample Yes/No Data Sufficiency Question
Check out a sample Value Data Sufficiency Question
Strategies for Performing well on GMAT Data Insights
So how do you get through 20 complex questions in only 45 minutes? Here are a few keys to succeeding:
- Know the question formats by heart. DI questions can be—and in fact, are meant to be—overwhelming. By knowing the formats in advance, you’ll be setting yourself up for success. That’s one part of the section that won’t be overwhelming!
- Prepare yourself for strict time management. You get no partial credit for a question in DI. Furthermore, many of the 20 “questions” have multiple parts. So if you miss one part of a three-part question, you get zero points for that question. Careful prep with timed practice is key to mastering DI pacing challenges!
- Get into an executive mindset. Executive function, that is, not business executive. These skills involve things like choosing priorities, evaluating benefits and liabilities, and coming up with strategies. Practice this by reading materials like The Wall Street Journal and The Economist to read and review different types of analyses.
- Work on your visual literacy. Charts and graphs are extremely important in GMAT DI! Again, The Wall Street Journal and The Economist can be incredibly helpful here. Make sure that you work not only on breaking down the parts of a graph, but also on understanding and analyzing them in context.
A Final Note
GMAT Data Insights questions are designed to throw a lot of data at you, fast. And while a lot of test-takers will let that throw them off their game, you can ensure that you’re all set for test day by familiarizing yourself with these question types and practicing, practicing, practicing! The more used to the question types you are, the easier your test day experience will be. Good luck!