

After taking the SAT and waiting what feels like forever for your scores (even though it’s actually more like two to three weeks!), you’re probably wondering: what’s a good SAT score range, and how does yours stack up? Generally, a good score is 1200-1400+. However, this range comes with many caveats!
The ranges of “good scores” vary a lot depending on both your goals and your age. The more competitive your dream schools are, the higher your target score should be. On the other hand, you can expect your scores to increase as you go through high school. For that reason, if you’re a sophomore, 1300 is a good score, while a freshman should be very pleased with scores of 1200 or higher.
Want to find out exactly what a good score would be for you and your goals? Read on for more information about SAT scores—from average SAT scores to SAT score charts, we have all the data you need.
Table of Contents
- What Is a Good SAT Score Range for Colleges?
- SAT Score Scale: The Basics
- What Are SAT Percentiles?
- What Is a Good Score for Scholarships?
- How Does the Adversity Index Impact My Score?
- How Can I Improve My Scores?
What Is a Good SAT Score Range for Colleges?
Let’s face it: at the end of the day, there is no “SAT passing score.” What is considered a good score depends almost entirely on the colleges that you’re applied to.
Keeping in mind the general SAT score range to aim for, let’s take a closer look at good scores for your dream school. Just to make things a little easier on you, we’ve put together this table of score ranges for the top universities in the United States. The numbers are from the middle 50% score range (meaning 25% of admitted students had lower scores and 25% had higher scores).
Type the name of your chosen school in the search box to find its middle 50% SAT score range!
SAT Score Scale: The Basics
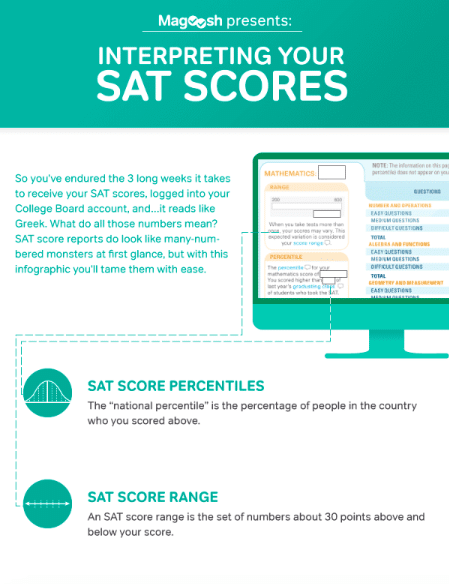
Before you send your score report to admissions officers, make sure you understand the SAT scoring scale. What is the SAT out of? What’s the top SAT score? Knowing these things can help you figure out what a good score is for you and what your goals should be.
Basically, SAT test scores are given both by section and overall. Here’s a quick breakdown of the sectional SAT score scale and how it contributes to the composite score. Note that this “new” SAT scoring applies to tests from 2016 onwards—scores were different on previous versions of the SAT, with a top SAT score of 2400!
- You’ll receive two sectional scores, one Math and one Verbal (combined from the Reading and Writing sections).
- Math score range: 200-800 points
- Evidence-Based Reading & Writing score range: 200-800 points
- The average SAT score on each section is 500 points, give or take 30 points (in 2020, the average EBRW score was 528 and the average math score was 529).
- Your Math and Reading/Writing sectional scores add up to a composite (combined) score. The highest composite score you can earn on the SAT is 1600 points.
- Composite score range: 400-1600 points
- The average composite score is about 1000 points (the average overall composite score in 2020 was 1051).
What Are SAT Percentiles?
Another way of evaluating your scores is to look at percentiles. Your SAT percentile measures the percentage of test-takers who got a lower score than you did. This means that percentile numbers, much like score numbers, indicate better test performance when they’re higher.
Here’s how to find your score percentiles on your online score report.
Basically, SAT percentiles compare your scores to average scores. Because the SAT is a standardized test, it means that these scores are easily comparable. This information falls along a bell curve:
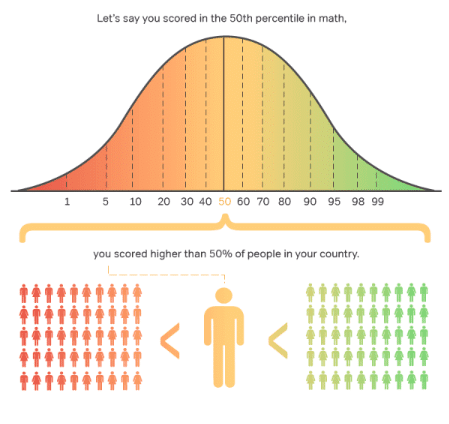
If you’re in the 91st percentile, for example, it means that only 9% of all other scores are higher than yours. In contrast, in the 30th percentile, 30% of all other test takers would have lower scores than you… and roughly 70% of the scores were higher than yours. This would place you in the bottom half of the year’s test-takers, in terms of performance.
SAT percentiles are calculated annually. Click the arrows below to see the College Board’s most recently released SAT User percentiles (meaning only juniors and seniors).
SAT Percentiles (Composite)
| Total (Composite) Score | Percentile |
|---|---|
| 1600 | 99+ |
| 1590 | 99+ |
| 1580 | 99+ |
| 1570 | 99+ |
| 1560 | 99+ |
| 1550 | 99+ |
| 1540 | 99+ |
| 1530 | 99+ |
| 1520 | 99+ |
| 1510 | 99 |
| 1500 | 99 |
| 1490 | 99 |
| 1480 | 99 |
| 1470 | 99 |
| 1460 | 99 |
| 1450 | 98 |
| 1440 | 98 |
| 1430 | 98 |
| 1420 | 98 |
| 1410 | 97 |
| 1400 | 97 |
| 1390 | 97 |
| 1380 | 96 |
| 1370 | 96 |
| 1360 | 95 |
| 1350 | 94 |
| 1340 | 94 |
| 1330 | 93 |
| 1320 | 93 |
| 1310 | 92 |
| 1300 | 91 |
| 1290 | 90 |
| 1280 | 89 |
| 1270 | 88 |
| 1260 | 87 |
| 1250 | 86 |
| 1240 | 85 |
| 1230 | 84 |
| 1220 | 83 |
| 1210 | 82 |
| 1200 | 81 |
| 1190 | 80 |
| 1180 | 78 |
| 1170 | 77 |
| 1160 | 76 |
| 1150 | 74 |
| 1140 | 73 |
| 1130 | 71 |
| 1120 | 70 |
| 1110 | 69 |
| 1100 | 67 |
| 1090 | 65 |
| 1080 | 63 |
| 1070 | 61 |
| 1060 | 60 |
| 1050 | 58 |
| 1040 | 56 |
| 1030 | 54 |
| 1020 | 52 |
| 1010 | 50 |
| 1000 | 48 |
| 990 | 46 |
| 980 | 44 |
| 970 | 42 |
| 960 | 40 |
| 950 | 38 |
| 940 | 36 |
| 930 | 35 |
| 920 | 33 |
| 910 | 31 |
| 900 | 29 |
| 890 | 27 |
| 880 | 26 |
| 870 | 24 |
| 860 | 23 |
| 850 | 21 |
| 840 | 20 |
| 830 | 18 |
| 820 | 17 |
| 810 | 16 |
| 800 | 14 |
| 790 | 13 |
| 780 | 11 |
| 770 | 10 |
| 760 | 9 |
| 750 | 8 |
| 740 | 7 |
| 730 | 6 |
| 720 | 5 |
| 710 | 4 |
| 700 | 4 |
| 690 | 3 |
| 680 | 2 |
| 670 | 2 |
| 660 | 1 |
| 650 | 1 |
| 640 | 1 |
| 630 | 1 |
| 620 | 1- |
| 610 | 1- |
| 600 | 1- |
| 590 | 1- |
| 580 | 1- |
| 570 | 1- |
| 560 | 1- |
| 550 | 1- |
| 540 | 1- |
| 530 | 1- |
| 520 | 1- |
| 510 | 1- |
| 500 | 1- |
| 490 | 1- |
| 480 | 1- |
| 470 | 1- |
| 460 | 1- |
| 450 | 1- |
| 440 | 1- |
| 430 | 1- |
| 420 | 1- |
| 410 | 1- |
| 400 | 1- |
SAT Percentiles (Math)
| Total Score (Section) | Percentile (Evidence-Based Reading and Writing) |
|---|---|
| 800 | 99+ |
| 790 | 99+ |
| 780 | 99 |
| 770 | 99 |
| 760 | 99 |
| 750 | 98 |
| 740 | 98 |
| 730 | 97 |
| 720 | 97 |
| 710 | 96 |
| 700 | 95 |
| 690 | 94 |
| 680 | 93 |
| 670 | 92 |
| 660 | 91 |
| 650 | 90 |
| 640 | 89 |
| 630 | 87 |
| 620 | 85 |
| 610 | 83 |
| 600 | 81 |
| 590 | 79 |
| 580 | 76 |
| 570 | 73 |
| 560 | 71 |
| 550 | 68 |
| 540 | 65 |
| 530 | 61 |
| 520 | 57 |
| 510 | 52 |
| 500 | 47 |
| 490 | 44 |
| 480 | 40 |
| 470 | 36 |
| 460 | 32 |
| 450 | 29 |
| 440 | 25 |
| 430 | 23 |
| 420 | 20 |
| 410 | 17 |
| 400 | 15 |
| 390 | 13 |
| 380 | 10 |
| 370 | 9 |
| 360 | 7 |
| 350 | 5 |
| 340 | 4 |
| 330 | 3 |
| 320 | 2 |
| 310 | 1 |
| 300 | 1 |
| 290 | 1 |
| 280 | 1- |
| 270 | 1- |
| 260 | 1- |
| 250 | 1- |
| 240 | 1- |
| 230 | 1- |
| 220 | 1- |
| 210 | 1- |
| 200 | 1- |
SAT Percentiles (Evidence-Based Reading and Writing)
| Total Score (Section) | Percentile (Math) |
|---|---|
| 800 | 99+ |
| 790 | 99+ |
| 780 | 99+ |
| 770 | 99+ |
| 760 | 99+ |
| 750 | 99 |
| 740 | 99 |
| 730 | 99 |
| 720 | 98 |
| 710 | 97 |
| 700 | 97 |
| 690 | 96 |
| 680 | 95 |
| 670 | 93 |
| 660 | 92 |
| 650 | 90 |
| 640 | 88 |
| 630 | 86 |
| 620 | 84 |
| 610 | 81 |
| 600 | 79 |
| 590 | 76 |
| 580 | 74 |
| 570 | 71 |
| 560 | 68 |
| 550 | 65 |
| 540 | 62 |
| 530 | 58 |
| 520 | 55 |
| 510 | 51 |
| 500 | 48 |
| 490 | 44 |
| 480 | 41 |
| 470 | 38 |
| 460 | 34 |
| 450 | 31 |
| 440 | 28 |
| 430 | 24 |
| 420 | 22 |
| 410 | 19 |
| 400 | 16 |
| 390 | 13 |
| 380 | 11 |
| 370 | 9 |
| 360 | 7 |
| 350 | 5 |
| 340 | 3 |
| 330 | 2 |
| 320 | 2 |
| 310 | 1 |
| 300 | 1 |
| 290 | 1- |
| 280 | 1- |
| 270 | 1- |
| 260 | 1- |
| 250 | 1- |
| 240 | 1- |
| 230 | 1- |
| 220 | 1- |
| 210 | 1- |
| 200 | 1- |
What Is a Good Score for Scholarships?
Many colleges around the country have what are called guaranteed scholarships. These scholarships are automatically awarded to accepted students who have earned a certain SAT score.
A larger number of colleges also have general merit scholarships. These scholarships have the same SAT requirements, but you are in competition with other accepted students for a limited number of awards. These scholarships may require a separate application, along with a personal or themed essay.
Scholarships based on academic merit often have minimum scores provided in their descriptions. Take note of any score requirements you find during your research, then average all those scores. The result is your minimum score goal for scholarships. To see the types of scholarships out there, check out our article What’s a Good SAT Score for Scholarships?
![]()
How Does the Adversity Index Impact My Score?
If you’ve been paying attention to SAT news lately, you may have heard about College Board’s new adversity index. This is a measurement that they will give to colleges to contextualize your scores in terms of relative advantage/disadvantage.
By creating this new measure, the College Board hopes to show how students from low-income and minority populations perform compared to other students from similar backgrounds. While this has been controversial, the adversity index will not affect scores themselves.
Instead, what it will give schools is an understanding of your percentiles based on both your “Environmental Context” and your “High School Context.” Again, this won’t change your score at all, but instead give universities one more measure with which to interpret your scores.
![]()
How Can I Improve My Scores?
Check out this video for tips to boost your score, and read on for resources to help you before and during test day! You can also use these tips if you’re planning on retaking the SAT.
- Make use of a SAT study schedule—knowing how to study for the SAT is a huge factor in improving your score!
- Take a free, full-length SAT practice test to establish a baseline score.
- Review our tips for pacing yourself during an exam.
- Find ways to remain calm when a question flusters you.
- Learn how to avoid careless mistakes in the future. (Magoosh’s SAT study guide has great tips to help with this!)
![]()
A Final Note
“How do my SAT scores stack up?” It’s a question that almost every test taker has asked at some point! By taking a look at the score ranges for the colleges you’re applying to, comparing your scores to the national average scores with percentile rankings, and working your test prep to keep improving your score when necessary, you’ll have everything you need to understand how your score will impact your college admissions!
Still unsure whether you want to take the SAT or ACT? Wondering how your scores stack up to potential ACT scores? Check out Magoosh’s SAT to ACT conversion!
All Magoosh SAT prep plans are digital SAT ready! Start studying today.


Leave a Reply