The answer is no, a function cannot have more than two horizontal asymptotes. But let’s take some time to find out why.
Definition of Horizontal Asymptote
First of all, what is a horizontal asymptote anyway? A horizontal asymptote for a function is a horizontal line that the graph of the function approaches as x approaches ∞ (infinity) or -∞ (minus infinity). In other words, if y = k is a horizontal asymptote for the function y = f(x), then the values (y-coordinates) of f(x) get closer and closer to k as you trace the curve to the right (x→ ∞) or to the left (x→ -∞). For example, the graph shown below has two horizontal asymptotes, y = 2 (as x→ -∞), and y = -3 (as x→ ∞).
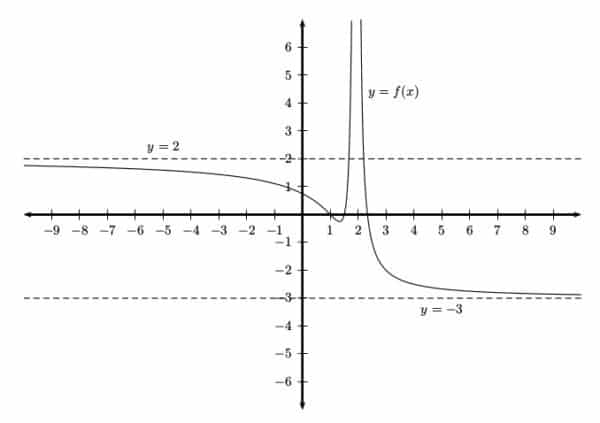
In fact, the mathematically precise definition for horizontal asymptotes involve limits. We say that y = k is a horizontal asymptote for the function y = f(x) if either of the two limit statements are true:
![]()
There are literally only two limits to look at, so that means there can only be at most two horizontal asymptotes for a given function.
Horizontal Asymptotes vs. Vertical Asymptotes
So how many horizontal asymptotes can a function have? You may know the answer for vertical asymptotes; a function may have any number of vertical asymptotes: none, one, two, three, 42, 6 billion, or even an infinite number of them! However the situation is much different when talking about horizontal asymptotes. By definition, there can be no more than two, one as you trace the curve to the left, and one as you trace the curve to the right. However a given function may have one or no asymptotes rather than two.
Graphs With No Horizontal Asymptotes
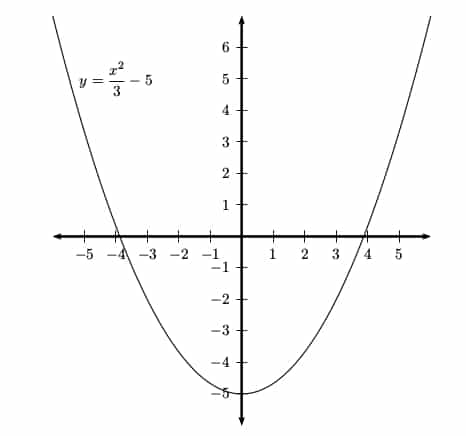
Many graphs do not have any horizontal asymptotes at all. For example, every polynomial function of degree at least 1 has no horizontal asymptotes. Instead of leveling off, the y-values simply increase or decrease without bound as x heads further to the left or to the right.
Single Horizontal Asymptotes
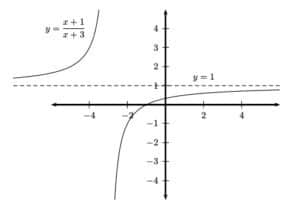
Some graphs have a single horizontal asymptote. This can happen when the graph levels off only towards the left or only towards the right. It also happens if the graph levels off in both directions but approaches the same y-coordinate. These situations are shown below.
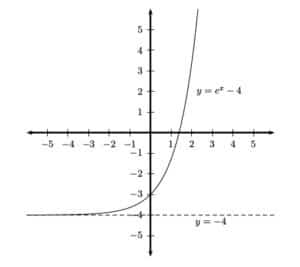
On the left, the graph of a typical exponential function has one horizontal asymptote. You can see how the graph seems to get closer to the line y = -4 as x becomes more and more negative. In other words, as you trace your finger on the graph as far to the left as you can go, the y-coordinates seem to settle on the value -4.
The graph on the right shows a typical rational function. Tracing the graph either to the left or right, the y-coordinates approach a value of 1 in this example.
- Useful fact about rational functions (fractions of polynomials): if a rational function has a horizontal asymptote at all, then it will have only one.
Multiple Horizontal Asymptotes
Ok, so what kinds of functions have two horizontal asymptotes? One important example is the arctangent function, f(x) = arctan x (also known as the inverse tangent function, f(x) = tan-1 x). As x→ ∞ the y-values approach π/2, and as x→ -∞, values approach -π/2. Thus, arctan x has two horizontal asymptotes, y = π/2 and y = -π/2.
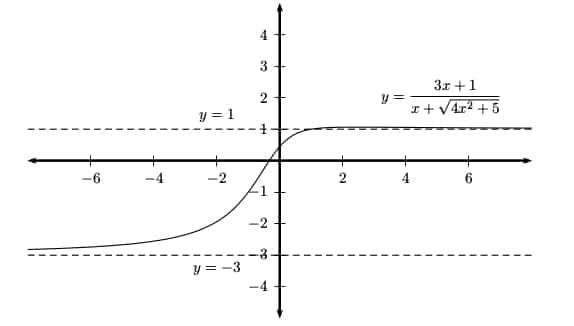
Often when there is a radical involved as part of a fraction of two functions, then a second horizontal asymptote may appear. These are quite challenging to analyze simply from the expression of the function (you really need a good understanding of infinite limits to break these apart), so I recommend just looking at the graph whenever possible. Here’s an example.
Conclusion
A function can have zero, one, or two horizontal asymptotes, but no more than two.
Certain kinds of functions always have a specific number of asymptotes, so it pays to learn the classification of functions as polynomial, exponential, rational, and others. More challenging problems may require working out infinite limits or carefully graphing the function. A little knowledge goes a long way on the AP Calculus exam!


Leave a Reply