At the heart of calculus is the concept of functions and their graphs. All of the main areas of calculus, including limits, derivatives, and integrals, require a firm understanding of functions. In this review we will explore what you need to know about functions and their graphs in order to succeed on the AP Calculus exams.
The main concepts concerning graphing and functions include:
- Evaluating functions
- Domain and range
- Graphing (including intercepts and asymptotes)
- Finding limits and determining continuity from the graph
- Increase, decrease, and relative extrema
- Concavity and inflection points
Functions and their Graphs
Let’s start with the basics.
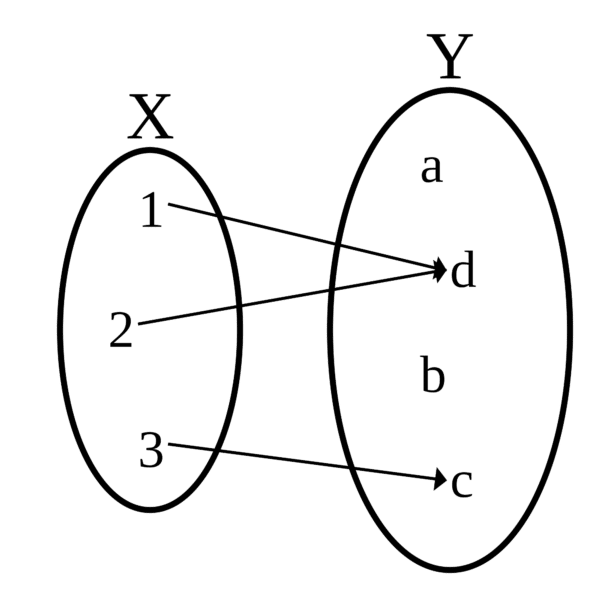
By definition a function is just a rule that assigns to each input x a well-defined output y. We use the notation y = f(x) to indicate that x is the input, y is the output, and f is the name of the function.
In principle, the input and output could be anything: numbers, vectors, symbols, even other functions! Typically in calculus the input and output are real numbers.
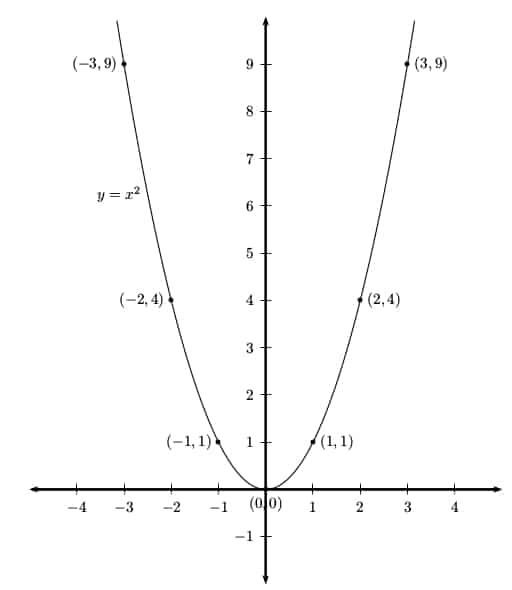
Generally a function in calculus is defined by an expression that shows how to calculate the output from any given input. For example, the squaring function f(x) = x2 has input x and output y = x2.
Evaluating Functions
Evaluating a function on a given input is often called plugging in. Continuing with our example, f(x) = x2, let’s see how to evaluate f at various inputs.
- f(3) = 32 = 9.
- f(-1/5) = (-1/5)2 = 1/25.
- f(c) = c2.
- f(c + h) = (c + h)2 = c2 + 2ch + h2.
- If g(x) = x – 12, then f(g(x)) = f(x – 12) = x2 – 24x + 144.
The last example in the list illustrates a composition of two functions, f and g. Understanding how compositions work helps you to make sense of the Chain Rule for derivatives and the Substitution Rule for integrals.
Domain
The domain of a function f(x) is the set of all input values (x-values) for the function.
Unless further information is given, we look for the natural domain, which is the largest set of x-values that makes sense for the function.
For example, the domain of f(x) = x2 is the set of all real numbers, or (-∞, ∞) in interval notation. Any real number at all can serve as input for this function.
On the other hand, the domain of a rational function such as ![]() excludes any x-values for which the denominator evaluates to zero. Factoring the bottom in this example,
excludes any x-values for which the denominator evaluates to zero. Factoring the bottom in this example,
![]()
We find that x = 5 and x = -2 must be excluded. Therefore the domain is: (-∞, -2) U (-2, 5) U (5, ∞).
Range
The range of a function is the set of all output values (y-values) for the function.
Finding the range is quite a bit more challenging than finding domain in general. It helps to memorize the domains and ranges of simple functions first.
| Function | Domain | Range |
|---|---|---|
| x2 | (-∞, ∞) | [0, ∞) |
| √ x | [0, ∞) | [0, ∞) |
| 1/x | (-∞, 0) U (0, ∞) | (-∞, 0) U (0, ∞) |
| sin x | (-∞, ∞) | [-1, 1] |
| cos x | (-∞, ∞) | [-1, 1] |
| ex | (-∞, ∞) | (0, ∞) |
| ln x | (0, ∞) | (-∞, ∞) |
Then more complicated functions may be analyzed using the properties of scaling and translations.
For example, we can deduce that the range of f(x) = (x + 3)2 – 7 is (-7, ∞) because f is just a translation of the graph of x2 by 7 units down (and 3 units left, which doesn’t affect the range).
Here’s a good refresher for domain and range.
Graphing
The graph of a function f is the set of all points (x, y) that satisfy y = f(x). In other words, at each x-value, plug into the function to determine the corresponding y-value.
For example, to graph f(x) = x2, evaluate the function at a few points. Then plot each point (x, x2) on the coordinate plane and connect the dots with a smooth curve.
Graphing a function can be time-consuming, but if you’re working on a section of the AP Calculus exam that allows a calculator, then just use your calculator’s graphing feature.
Intercepts and Asymptotes
The intercepts and asymptotes are important features that help us to accurately graph a function. In fact, it’s also helpful to know how to locate the intercepts and asymptotes directly from a given graph.
The Intercepts of a Graph
The y-intercept of a function f(x) is the point where the graph crosses the y-axis. There can be only one. Simply plug in x = 0 to find it. But if 0 is not in the domain of the function, then it has no y-intercept.
An x-intercept of a function f(x) is any point where the graph crosses the x-axis. In contrast to the y-intercept, there can be many x-intercepts for a given graph. To find them, set f(x) = 0 and solve.
The Asymptotes of a Graph
There are three types of asymptote.
- A vertical asymptote for a function is a vertical line x = k showing where the function becomes unbounded.
- A horizontal asymptote for a function is a horizontal line that the graph of the function approaches as x approaches ∞ or -∞.
- An oblique asymptote for a function is a slanted line that the function approaches as x approaches ∞ or -∞.
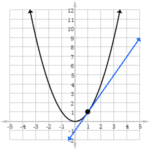
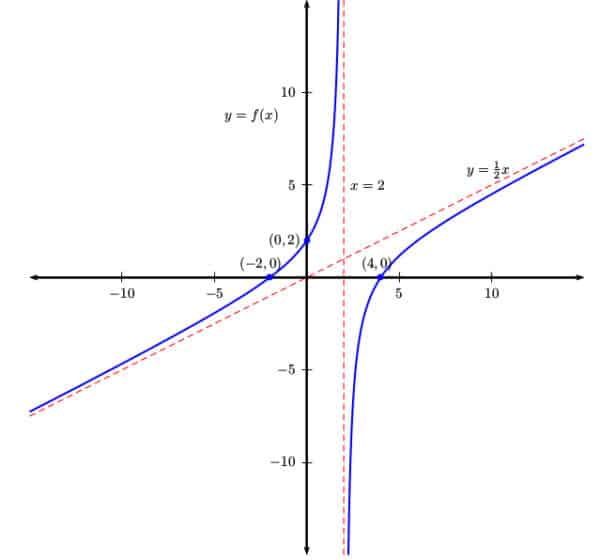
Example
Below you can see an example graph with the intercepts and asymptotes labeled.
For more information and examples, check out these article about horizontal asymptotes, vertical asymptotes, and oblique asymptotes.
Graphs, Limits, and Continuity
On the AP Calculus exams you will sometimes need to find limits from a given graph.
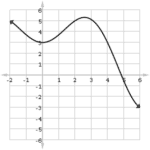
For example, in the graph below, we can determine that ![]()
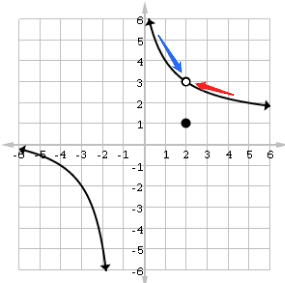
You can also see that the above graph is continuous everywhere except at x = -1 (where there is a vertical asymptote) and x = 2 (where the limit value does not equal the function value). Thus, this function is continuous on (∞, -1) U (-1, 2) U (2, ∞).
For more information, check out AP Exam Review: Limits and Continuity.
Using Derivatives to Analyze Functions and their Graphs
Part of the what makes calculus so useful is its ability to analyze the behavior of functions without having the graph as a guide. Using derivatives (and second derivatives), one can determine:
- On what interval(s) does the graph increase or decrease?
- Where are the relative extrema (relative minimum and maximum points)?
- On what interval(s) is the graph concave up or down?
- Where are the points of inflection?
Check out the AP Calculus Exam Review: Analysis of Graphs for further explanation of these more advanced topics.
Summary
There is a lot to know about functions and their graphs. This short review just gives the basics. Now it’s up to you to explore further!