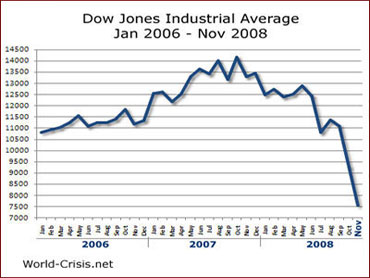
In this article we take a look at how calculus can be used in the analysis of graphs. It’s important to know what limits and derivatives can tell us about graphs, not only on the AP Calculus exams, but also in real world applications. Wouldn’t it be nice to know about the ups and downs of the stock market?
What can Calculus Tell us about Graphs?
Calculus is a method for studying rates of change of functions. Because we often represent functions by their graphs, you could say that calculus is all about the analysis of graphs.
We will review the main topics that you’ll need to know for the AP Calculus exams. Analysis of graphs (or curve sketching) includes finding:
- Domain and range
- Intercepts
- Asymptotes
- Relative extrema and intervals of increase and decrease
- Points of inflection and intervals of concavity
Domain, Range, and Intercepts
Actually, finding the domain, range, and intercepts requires no calculus at all. These are standard topics in algebra and pre-calculus. However, it doesn’t hurt to review the concepts.
Domain
The domain of a function f(x) is the set of all input values (x-values) for the function.
Unless further information is given, we look for the natural domain, which is the largest set of x-values that makes sense for the function.
Look at the form of the function. If there are fractions, then you must exclude any x-values that make the denominator equal to zero. If there are square roots, then exclude any x-values that make the expression under the radical negative.
Let’s find the domain of √ x – 5 .
Here we set x – 5 ≥ 0, which implies that x ≥ 5. As an interval, the domain would be [5, ∞).
Range
The range of a function f(x) is the set of all output values (y-values) for the function.
Finding the range is quite a bit more challenging than finding domain in general. You can rely on certain properties of functions. For example, x2 ≥ 0, and √ x ≥ 0.
Here’s a good refresher for domain and range.
Intercepts
The y-intercept of a function f(x) is the point where the graph crosses the y-axis. There can be only one. Simply plug in x = 0 to find it. But if 0 is not in the domain of the function, then it has no y-intercept.
For example, the function f(x) = x2 – 4 has a y-intercept at (0, -4), because f(0) = 02 – 4 = -4.
An x-intercept of a function f(x) is any point where the graph crosses the x-axis.
In contrast to the y-intercept, there can be many x-intercepts for a given graph. To find them, set f(x) = 0 and solve.
For example, there are two x-intercepts for f(x) = x2 – 4. Setting the function equal to 0 and solving, we get:
![]()
Therefore the points (2, 0) and (-2, 0) are the x-intercepts for the function.
Asymptotes
An important part of analysis of graphs is finding the asymptotes, if any exist. Limits can be used to find the various kinds of asymptote.
- A vertical asymptote for a function is a vertical line x = k showing where the function becomes unbounded.
- A horizontal asymptote for a function is a horizontal line that the graph of the function approaches as x approaches ∞ or -∞.
- An oblique asymptote for a function is a slanted line that the function approaches as x approaches ∞ or -∞.
For more information and examples, check out these article about horizontal asymptotes, vertical asymptotes, and oblique asymptotes.
Relative Extrema and Increase/Decrease
The term relative extrema refers to both relative minimum and relative maximum points on a graph. In other words, the “peaks and valleys.” In the intervals between the relative extrema, the function may increase or decrease. The key idea is that the first derivative measures increase and decrease.
- Find the first derivative, f '(x).
- Set f '(x) = 0 and solve for x to find the critical numbers for the function. These are the locations of possible relative extrema. The critical numbers also give you the endpoints of all the intervals of increase and/or decrease.
- Choose sample points within each interval.
- Plug each sample point into the first derivative, f '(x). If the results is positive, then f is increasing in that interval. If negative, then f is decreasing in that interval.
I like to organize my work in a table or on a number line.
Use the First Derivative Test to locate the relative minima and maxima. This is not too difficult; just look for critical numbers at which the direction changes. Equivalently, look for changes in the sign of the derivative.
If signs change from positive to negative (increase to decrease), then there is a relative maximum at that critical number. If signs change from negative to positive (decrease to increase), then there is a relative minimum there.
Example 1
Find the relative extrema and intervals of increase/decrease for f(x) = x3 – 27x + 10.
The first derivative is f '(x) = 3x2 – 27. Set this equal to 0 and solve:
![]()
The critical numbers are x = -3 and 3. This means there will be three intervals to keep track of: (-∞, -3), (-3, 3), and (3, ∞). Choose samples in each interval, for example, -4, 0, and 4. There will always be one more sample point than critical number.
Plug in each sample point into the first derivative and look for positive vs. negative values.
| Interval | Sample | Derivative value | Conclusion |
|---|---|---|---|
| (-∞, -3) | -4 | 3(-4)2 – 27 = 21 > 0 | Increasing |
| (3, -3) | 0 | 3(0)2 – 27 = -27 < 0 | Decreasing |
| (3, ∞) | 4 | 3(4)2 – 27 = 21 > 0 | Increasing |
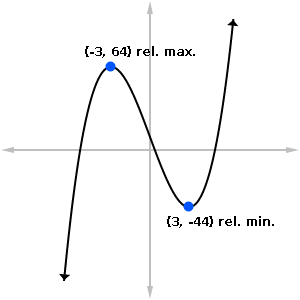
According to the table, there is a relative maximum at x = -3, and a relative minimum at x = 3. Finally, plugging those two points back into the original function, f(x) = x3 – 27x + 10, gives the y-coordinates for your answer:
Relative minimum point: (3, f(3)) = (3, -44).
Relative maximum point: (-3, f(-3)) = (-3, 64).
Increasing on: (-∞, -3) U (3, ∞).
Decreasing on: (-3, 3).
Below is a sketch of the graph showing the relative extrema. Notice how the curve increases until it reaches x = -3, decreases in the middle, and then increases when x > 3.
Inflection Points and Concavity
Concavity is a measure of how curved the graph is. Informally, we say a graph is “concave up if it looks like a cup, and concave down if it looks like a frown.” A given function may have both kinds of concavity in its graph. Any point at which concavity changes (from up to down or down to up) is called a point of inflection.
While it is sometimes difficult to determine the concavity of a graph visually, it is actually very easy to determine it using calculus. In fact, if you can do intervals of increase and decrease and relative extrema, then you already know the correct technique! Just apply all of the same steps to the second derivative rather than the first.
- Find the second derivative, f ''(x).
- Set f ''(x) = 0 and solve for x to find the possible points of inflection for the graph. These numbers also give you the endpoints of all the intervals of concavity.
- Choose sample points within each interval.
- Plug each sample point into the second derivative, f ''(x). If the results is positive, then f is concave up in that interval. If negative, then f is concave down in that interval.
Next look to see if there are any changes of concavity. What we have called possible points of inflection will be actual points of inflection only if the concavity is different on either side of the point.
Example 2
Find the point(s) of inflection and intervals of concavity for f(x) = x3 – 27x + 10.
We already have the first derivative, which is f '(x) = 3x2 – 27. But now we need the second.
f ''(x) = 6x.
Set equal to 0 and solve: 6x = 0. Thus x = 0 is the only possible point of inflection.
The table below records our analysis. Note, because of the change in concavity, there is an inflection point at x = 0.
| Interval | Sample | Second Derivative | Conclusion |
|---|---|---|---|
| (-∞, 0) | -1 | 6(-1) = -6 < 0 | Concave Down |
| (0, ∞) | 1 | 6(1) = 6 > 0 | Concave Up |
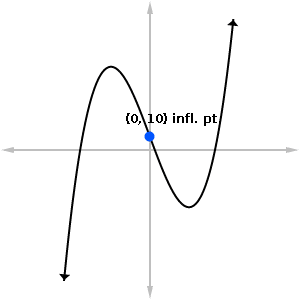
Inflection point: (0, f(0)) = (0, 10).
Concave up on: (0, ∞).
Concave down on: (-∞, 0).
Here is the graph with the inflection point highlighted. To the left of this point, the curve is concave down, while to the right it’s concave up.
Summary
There are many aspects to the analysis of graphs. Be sure you are familiar with each concept and know which tool helps to find it.
- Domain and range (algebra / pre-calculus)
- Intercepts (algebra / pre-calculus)
- Asymptotes (limits)
- Relative extrema and intervals of increase and decrease (first derivative)
- Points of inflection and intervals of concavity (second derivative)


