Integrated Reasoning Practice Question: Table Analysis

The following is a Table Analysis practice question, which will be part of the GMAT Integrated Reasoning section.

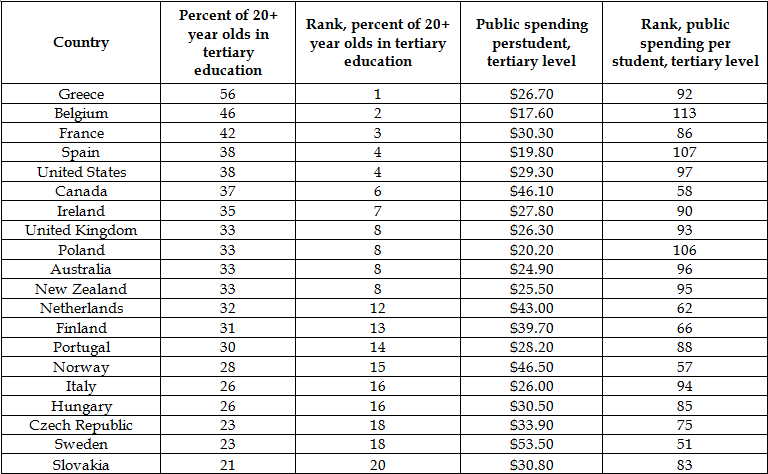
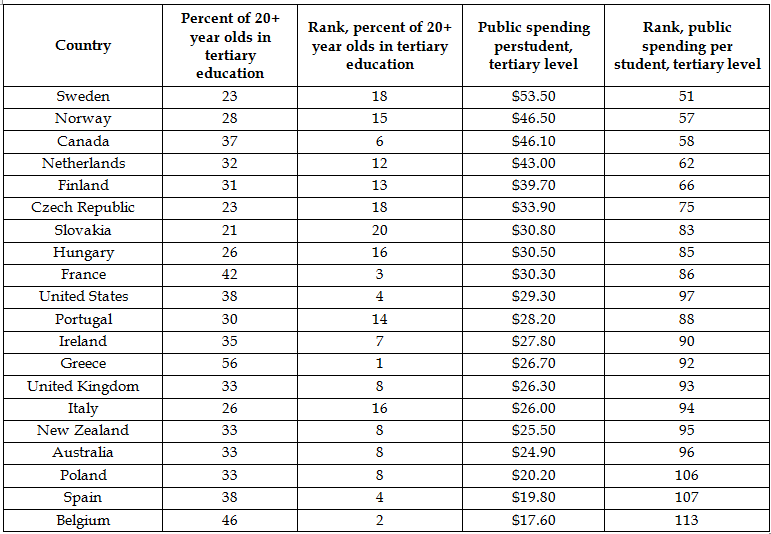
The following two tables show the same data ranked in two different ways.  (On the real GMAT, you will have sortable tables embedded in the page with the question.)

Note that “tertiary education” means all education following high school level: undergraduate as well as graduate studies.  Here, “in tertiary education” includes those now enrolled in those programs, as well as all who have completed degrees.  Note, also, many of the countries in the table have a high percent of total students in the table, and therefore rank considerably lower in public spending per tertiary student: countries with comparatively few students at the tertiary level rank much higher than the countries listed in the table.

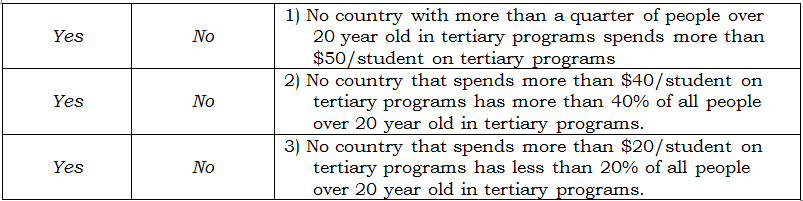
For each of the following questions, select Yes if the statement can be shown to be true based on the information in the table.  Otherwise, select No.

Improve your GMAT score with Magoosh.

Practice Question Answers

(1) Yes; (2) Yes; (3) No


Practice Question Explanations

(1)”No country with more than a quarter of people over 20 year oldin tertiary programs” – so these are all countries on the first table, from Hungary up.  Because those are all the top-ranking countries, no country not on the chart can be in this group.

No country in this group “spends more than $50/student on tertiary programs” – the only country in our table that spends more than $50/student is Sweden, which has just under a quarter (23%) of people over 20 year oldin tertiary programs.  So, no country in the table meets the combined criteria, and no other countries off the table can.  Therefore, the answer is Yes.


(2) Start with: “has more than 40% of all people over 20 year old in tertiary programs” – these are just three countries: Greece, Belgium, and France.  All three of them spend under $40/student.  Therefore, no country meets the combined criteria.  Therefore, the answer is Yes.

Improve your GMAT score with Magoosh.


(3) Start with: “has less than 20% of all people over 20 year old in tertiary programs.”  These are countries that are not represented in the table, because they are below Slovakia in their percentage of all people over 20 year old in tertiary programs.  We don’t have any information about where those countries fall, but clearly some of them would have to occupy ranks above 51st-place-ranked Sweden in spending per student.  Sweden spends $53.50/student, so 50 countries not on the table spend more than that, and if they are not on the table, they all rank below Slovakia in their percentage of all people over 20 year old in tertiary programs.  We actually can’t give a definitive answer, but we certainly do not have enough information to answer Yes to the question.  Because the information is unclear, the answer is No.

Ready to get an awesome GMAT score? Start here.

Most Popular Resources

Author

  • Mike MᶜGarry

    Mike served as a GMAT Expert at Magoosh, helping create hundreds of lesson videos and practice questions to help guide GMAT students to success. He was also featured as "member of the month" for over two years at GMAT Club. Mike holds an A.B. in Physics (graduating magna cum laude) and an M.T.S. in Religions of the World, both from Harvard. Beyond standardized testing, Mike has over 20 years of both private and public high school teaching experience specializing in math and physics. In his free time, Mike likes smashing foosballs into orbit, and despite having no obvious cranial deficiency, he insists on rooting for the NY Mets. Learn more about the GMAT through Mike's Youtube video explanations and resources like What is a Good GMAT Score? and the GMAT Diagnostic Test.

More from Magoosh

18 Responses to Integrated Reasoning Practice Question: Table Analysis

  1. Parul November 6, 2021 at 1:19 pm #

    Great Work in explaining the details Mike.
    Thanks, Parul

  2. Jacki July 16, 2014 at 6:19 am #

    Spot on with this write-up, I truly feel this website needs a great deal
    more attention. I’ll probably be returning to read through more, thanks for the advice!

    • Mike MᶜGarry
      Mike July 16, 2014 at 10:03 am #

      Dear Jacki,
      Thank you for your kind words. Best of luck to you!
      Mike 🙂

  3. Vikram April 26, 2012 at 11:41 pm #

    For question 3, arent we concerned with only the information that is given to us in the table. I looked up 2nd table and noted that all countries above SPAIN spend more than $20 per student and no country has less than 20% of its population. So i marked YES.

    What do think is incorrect in my analysis

    • Vikram April 26, 2012 at 11:43 pm #

      I hope i will be informed via email as and when i receive a reply

    • Mike MᶜGarry
      Mike April 27, 2012 at 3:22 pm #

      Vikram: when we consider information given in a table, part of what we have to consider is what is not explicitly shown but ineluctably suggested by data such as ranks. In the table, we explicitly see that Spain is ranked 107th in spending, so there are definitely 106 countries above it, only 18 of which are shown on the chart. This means 88 countries not shown are also above Spain. We absolutely and definitively know there are 88 other countries not shown above Spain from the information given in the chart. Does that make sense? You can’t afford to be a narrow literalist on IR. It’s never simply about: look *only* at what is absolutely in front of your face. It’s always about higher order reasoning: given this, what else do we know must be true? What inferences can we logically make? What new conclusions can we draw? IR is always going to penalize folks who refuse to move beyond simply what is in front of them.
      Does that make sense?
      Mike 🙂

      • Vikram May 9, 2012 at 9:08 pm #

        Mike: In that case same holds true for Q2. Only Sweden,Norway,Canada,Netherlands spend more than $40 and no one has more than 40% of students BUT following the approach in Q3 we can always say since all countries are no present in table there might be a country that spends more than $40 and has more than 40% of students. So answer to this one should be NO.

        P.S. Please inform me through email when someone replies (why email is asked if person is not informed)

        • Mike MᶜGarry
          Mike May 10, 2012 at 1:07 pm #

          Vikram: Remember — it’s not two completely different tables — it’s exactly the same information, ordered in two different ways. When we look at Table 1, we see clearly, only Greece, Belgium, and France have more than 40% of young people in tertiary ed., and because those are ranks 1, 2, & 3 in the world, we know no country not listed could possibly be higher than this. Thus, all unlisted countries must have less than 40% — in fact, the ranks are continuous through 20 on that table, so no unlisted country can have greater than 21%. The fact that Table #1 limits us to only three countries (Greece, Belgium, and France) is a fact we must take with us to Table 2 — the basic constraints apparent in Table 1 are still true when we look at Table 2, and vice versa, because it’s the same data set. That’s why the answer to Q2 is “yes” — we need only consider Greece, Belgium, and France, and none of those have more than $40.00. Table #2 does not set the same constraints at the top, because those ranks begin at rank 51 — we know there must be 50 countries not shown higher than $53.50. There’s a big difference between a list that begins with rank 1 and a list that begins with rank 51. Does that make sense?
          Mike 🙂

          • Vikram May 11, 2012 at 9:49 am #

            Thanks Mike, I got the gist BUT this is very tricky because Q2 and 3 are similar and most likely one would use same table (table 2) to arrive at results. The reason that same logic does not give correct answer on both is that RANKS ( as you pointed out) are mentioned and we can deduce that only 3 countries qualify for that.

            Try solving both the questions using Table 2 and you will realize what i am trying to explain. It’s too easy for someone to miss that ranks logic

            Having done that, please advise how to avoid such mistakes.

            • Mike MᶜGarry
              Mike May 11, 2012 at 11:22 am #

              Vikram: First, I will say, one of the essential things the Table Analysis questions test is the student’s ability to decide which table orientation is most pertinent to the question. On Table Analysis, the student has the capability of choosing the ordering of the table, and the GMAT never gives you a capability without testing your ability to handle it intelligently. Of course, of course, looking at only one table will lead to the wrong answer! That’s the very point! That’s precisely what the GMAT is testing, right there! Don’t get stuck staring at only one table for all the questions — that’s always a bad trap for the Table Analysis questions. Second of all, I will say — ranks are not just garnish, not just decoration — rather, they are vitally important information that is essential in many Table Analysis questions. Perhaps up until now you underestimated their importance, and so that logic was “too easy . . . to miss”. What I’m saying is: every single time ranks appear, it’s absolutely 100% guaranteed that you will have to use some logic involving the ranks to answer the question. Understand this clearly, and henceforth it will be easy not to miss their logic. Finally, I will say: Q2 and Q3 are *not* similar — rather, Q1 & Q2 are similar —- Q1 & Q2 both compare “more than” to “more than”, comparisons at the top ranks of the lists, but Q3 compares “more than” to “less than”, a very different structure. Does all this make sense?
              Mike 🙂

              • Vikram May 11, 2012 at 6:17 pm #

                THanks Mike, so the take-away is that in case RANKS is specified, look out for them when less than is specified in ques.because in case of more than entities will appear in the table.

                HEre’s one convoluted ques. from OG13, http://www.beatthegmat.com/og13-ir-q2-t111739.html#471006 please help

                • Mike MᶜGarry
                  Mike May 14, 2012 at 12:04 pm #

                  Vikram: I posted a full reply on that page on BTG.

                  Mike 🙂

          • Mihir December 19, 2012 at 8:31 am #

            In reference to the logic given in Q3 not being applicable in Q2: The ranks 1,2 and 3 of Greece, Belgium and France are of percentage of 20 year olds in Tertiary education and does not say anything about there being no more countries spending more than 40$/student. So there can be more countries in the same category.

            • Mike MᶜGarry
              Mike December 19, 2012 at 10:07 am #

              Mihir: I’m not sure whether you have a question and, if so, exactly what your question is. For Question #2, we know the only countries that have more than 40% of 20 y.o. in tertiary education are those three: Greece, Belgium, and France. They are ranks 1 & 2 & 3 and because we can see the countries tied for 4th below them, we know that there are only those three countries at those ranks, and no countries tied or above them. By contrast, when we look at the spending per student list, the highest is Sweden, rank = 51, so we know for a fact there are 50 countries with higher values of spending per student. This allows us to answer Q2: we can actually see the data relevant to this question.. Q3 is trickier, because it’s about countries not listed, and we have to draw inferences about what’s off the chart. Does all this make sense?
              Mike 🙂

              • Mihir December 19, 2012 at 11:02 am #

                Mike: Sorry for the confusing framing of the Q in the previous comment..
                So my question is: Aren’t we supposed to see the the ranks of public spending per student instead of seeing percent of 20 yr. old’s ranks, in the second Q, as the prerequisite for the question is ” No country that spends more than 40 dollar a week ”
                In which case there will be many (61) countries above Netherlands (ranked 62) to consider for the second requisite of percent of 20 yr olds in education where we have data only for Netherlands, Canada, Norway and Sweden..

                Mihir 🙂

                • Mike MᶜGarry
                  Mike December 19, 2012 at 7:53 pm #

                  Mihir
                  First of all, there are two different tables above, one ranked by percentage and the other ranked by spending per student. Scroll down the page slowly from the top, and you will see both tables. It’s true, on the second table, the highest rank country is Sweden (rank = 51). This means, there are fifty countries ranked higher that we DON’T SEE. This is precisely the kind of situation you could find on the GMAT IR — you are given data about certain units, and from the rank information, let only to draw inferences about the others.
                  Does all this make sense?
                  Mike 🙂

        • Margarette Jung
          Margarette May 10, 2012 at 2:27 pm #

          Hi, Vikram

          We’ve fixed the e-mail notifications (and I’ve personally sent you an e-mail, just in case!), so from now on, if you check the “Notify me of followup comments via e-mail”, you’ll be notified of any new responses. Sorry for the trouble!

          Best,
          Margarette

          • Vikram May 11, 2012 at 9:51 am #

            Thanks Margarette 🙂


Magoosh blog comment policy: To create the best experience for our readers, we will only approve comments that are relevant to the article, general enough to be helpful to other students, concise, and well-written! 😄 Due to the high volume of comments across all of our blogs, we cannot promise that all comments will receive responses from our instructors.

We highly encourage students to help each other out and respond to other students' comments if you can!

If you are a Premium Magoosh student and would like more personalized service from our instructors, you can use the Help tab on the Magoosh dashboard. Thanks!

Leave a Reply