

ACT Science questions are a little like olives; either you love them or you hate them. Yes, skeptical readers, there are some students out there who love the ACT Science test. But no matter where you fall on this love/hate spectrum, you absolutely can learn to do better on it—with ACT Science practice! Time to break out those ACT Science practice tests and ACT questions—because the ACT Science section is unlike anything you’ve ever seen.

Before we get to the practice questions, take a look at the top strategies that will help you get cozier with the ACT Science test and be fully prepared for it.
Table of Contents
ACT Science Practice Tips
Take Practice ACT Science Tests
The ACT Science test is unique. Unlike the English or Math sections, you can’t do effective preparation for it simply by studying, say, grammar rules or geometry formulas. Heck, you can’t even really prepare for it by studying science. This sounds rather ironic, but it is true. The ACT Science test is far more a test of scientific reasoning and data analysis than a test of science content or facts you’ve learned in your high school science classes.
So the most effective preparation for the ACT is to do lots of ACT Science questions. We have passages for you to practice with on Magoosh. You can also find five full-length tests in The Real ACT Prep Guide and official practice passages and a full-length test for free on the ACT Student website.
Once you develop a familiarity with the ACT Science test, it is crucial that you practice doing tests under timed conditions. There are generally 6 passages on the Science test and a 35-minute time limit, meaning you have a little less than 6 minutes per passage.
Some passages will take you more or less time than others, but time yourself to see if you are able to work at this approximate pace. If you are not, don’t get discouraged; this may just mean you need to focus on doing only 5 of the passages, or even 4, to get your best ACT score. But it’s really important that you figure this out in practice and not on the real thing.
Read Scientific Writing
The more you read about science, the more comfortable you will be with the lingo, terminology, and strange units on the ACT Science test. The Public Library of Science has some good free sources for you to read, but be forewarned that these articles are written for scientists and are more complex than what you will see on the ACT. Therefore, I only recommend this for students who are VERY serious about their ACT Science score.
If you aren’t ready to get that intense about your ACT Science study, you can devote a little more attention to your school’s science textbooks and lab experiments. Focus particularly on understanding the hypothesis, the control, the variables, and the results of the experiments you encounter.
Review Fundamental Scientific Concepts
Every ACT Science test will have a few questions that require you to bring in outside scientific knowledge. There won’t be many of these, and any outside knowledge required will be on a pretty basic level. The ACT doesn’t provide a list of what could be tested, but here’s a sense of what you will encounter based on subject area:
- Passages dealing with biology may involve body systems, cellular biology, photosynthesis, ecosystems, evolution, and genetics.
- Passages dealing with chemistry may feature some of these concepts: properties of matter, acids and bases, kinetics and equilibria, thermochemistry, organic chemistry, biochemistry, and nuclear chemistry.
- Passages dealing with chemistry cover mechanics (the behavior of physical bodies when subject to forces), thermodynamics (the study of the transfer of heat between materials), electromagnetism (the study of the interaction of electric currents and magnetic fields), fluids and solids (substances with no fixed shape and fixed shape, respectively), and optics (study of the behavior of light and radiation).
- Passages dealing with the physical sciences (or earth and space science) include topics in geology, astronomy, and meteorology.
You can also check out our free ACT Flashcard App, which contains definitions and examples for all the terms we suggest you know for the ACT Science test.
Ready to try authentic ACT Science passages? Take a stab at the sample passages and questions below.
![]()
ACT Science Practice Passages and Questions
Ready to apply what you’ve learned? Great! Here are sample ACT Science questions from all three areas of the Science section: Interpretation of Data, Scientific Investigation, and Models/Experiments. (They’re organized by question type, but note that on test day, these will all be mixed together.) Try one or two in areas of your strengths and weaknesses, or do them all at once–think of them as an ACT practice test in Science!
| Question Type | Easy | Medium | Hard |
|---|---|---|---|
| Interpretation of Data | Question 1 | Question 2 | Question 3 |
| Scientific Investigation | Question 4 | Question 5 | Question 6 |
| Models/Experiments | Question 7 | Question 8 | Question 9 |
We’ve provided clickable radio buttons for you to select your answer as you go through these ACT Science practice questions. This way, you can keep track of your answers and check your work at the end. However, please note that there’s no option to submit them!
ACT Science Practice: Interpretation of Data
In these ACT Science questions, you’ll need to manipulate and analyze scientific data presented in tables, graphs, and diagrams. You’ll find them in Data Representation and Research Summaries passages; you’ll rarely, if ever, see them in Conflicting Viewpoints passages, which already have enough information to process!
Question 1: Easy
Subject Area: Biology
Click here for the passage!
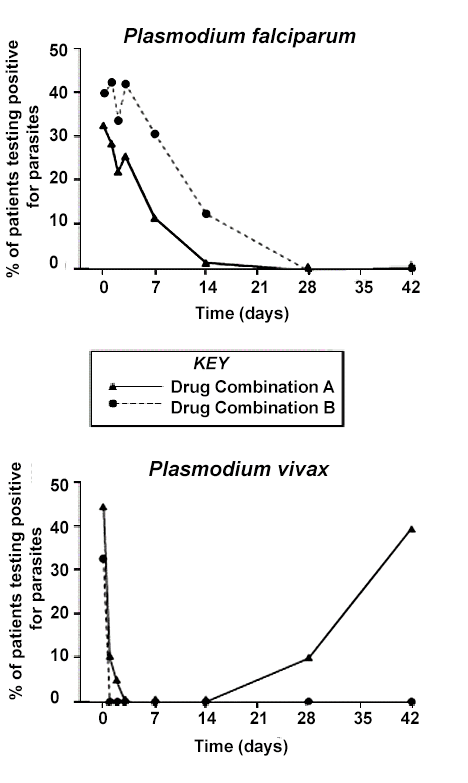
Malaria is an infectious disease that kills more than 600,000 people every year. Several species of the genus Plasmodium cause malaria, with two of the most common being Plasmodium falciparum and Plasmodium vivax. Though both species cause a very similar illness, P. falciparum malaria is more likely to result in fatalities than P. vivax malaria, while P. vivax malaria is more likely to recur — to return after a period of time during which the patient is healthy and has no parasites present in the blood.
The two species of malaria parasites respond differently to antimalarial medications, but in many areas where malaria is common, testing to determine what type of malaria a patient has is not widely available. Therefore malaria treatments are often tested against both species of the parasite, and first-line malaria treatments in these regions ideally should be effective against both parasites.
Experiment 1
For many years, public health professionals in Papua New Guinea have recommended a treatment regimen, Drug Combination A, as a first-line malaria treatment. Recently a new treatment regimen, Drug Combination B, has been proposed as a potential replacement for Combination A, and a study was conducted to compare their effectiveness.
Children entering a local health clinic with malaria symptoms were tested to determine which Plasmodium species they carried. The patients were then randomly assigned Drug Combination A or Drug Combination B, and their blood was tested periodically for the presence of parasites.
Figure 1
Experiment 2
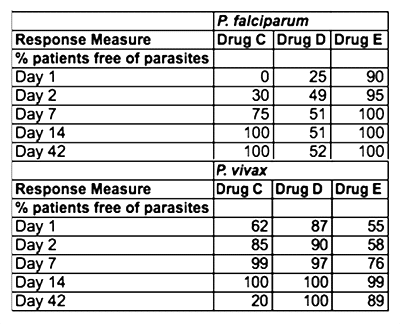
On rare occasions, patients have severe allergic reactions to a compound that is found in both Drug Combination A and Drug Combination B. In these cases, a second-line treatment must be used. A second study was conducted to determine which of several drug combinations would be the best second-line drug to recommend for use in Papua New Guinea. Table 1 shows the treatment response to the second-line drug combinations.
Table 1
According to Figure 1, the percentage of P. falciparum patients with parasites remaining in their blood on day 14 was approximately:
1% for patients treated with Drug Combination A, 12% for patients treated with Drug Combination B.
12% for patients treated with Drug Combination A, 1% for patients treated with Drug Combination B.
7% for patients treated with Drug Combination A, 14% for patients treated with Drug Combination B.
0% for both drug combinations.
Check the answer here!
Answer: (A) 1% for patients treated with Drug Combination A, 12% for patients treated with Drug Combination B.
Watch the video explanation here!
Question 2: Medium
Subject Area: Physics
Click here for the passage!
Loudness perception by the human ear varies as a function of intensity and frequency of the sound source. Intensity is a measure of the amount of energy from a source that hits the area that absorbs the sound. The subjective loudness level is a measure of how loud a sound feels to the human ear.

The threshold of hearing is the minimum intensity at each sound frequency required for a sound to be heard by humans. The threshold of pain is the maximum intensity at each sound frequency that humans can tolerate without pain. The figure below displays the variation in subjective loudness perception versus frequency and intensity. Each line on the graph represents a curve of equal loudness. Sound intensities are given in dB and W/m2, and frequencies are given in hertz [(Hz); 1 Hz = 1 cycle/sec]. Subjective loudness levels are given in phons.
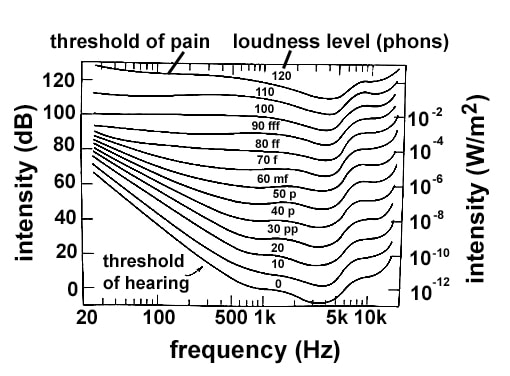
According to the figure, which of the following is closest to the lowest intensity that a frequency of 100 Hz can be heard by a human being?
0 dB
20 dB
40 dB
60 dB
Check the answer here!
Answer: (H) 40 dB.
Watch the video explanation here!
Question 3: Hard
Subject Area: Chemistry
Click here for the passage!
A covalent bond occurs when the nuclei of atoms share electrons, resulting in a stable balance of attractive and repulsive electrostatic forces. The potential energy of any system of two atoms capable of forming a covalent bond depends on the distance between the atoms. The more negative the potential energy, the greater the attractive force between the atoms.
Bond energy is the amount of energy released when a bond is formed, which is equivalent to the absolute value of the potential energy of two atoms in a covalent bond. Bonds of higher energies are more stable than bonds of lower energies. Bond length is the average distance between the nuclei of atoms in a covalent bond. Bond order is the number of electron pairs shared between the two atoms. For diatomic molecules, bond energy is equivalent to the dissociation energy, which is the amount of energy required to pull apart the atoms in a diatomic molecule.
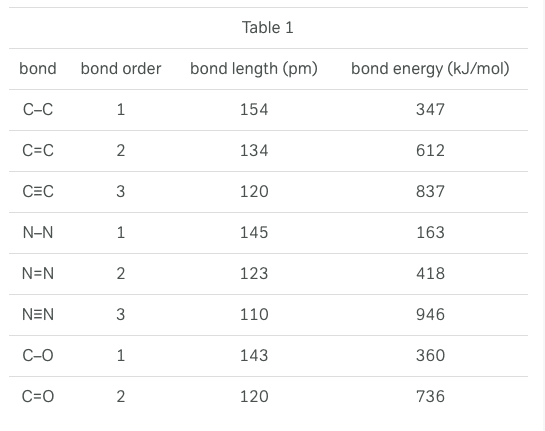
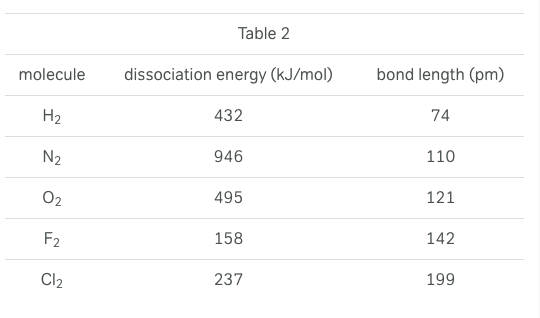
Figure 1 shows the potential energy curve for a system of two hydrogen atoms. Table 1 presents bond lengths and energies for covalent bonds of varying orders. Table 2 presents the bond length and dissociation energies for a number of diatomic molecules.
Figure 1
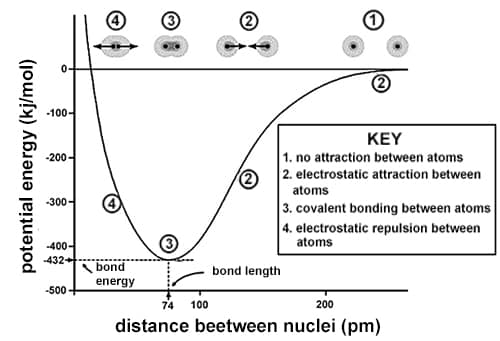
Based on information in the passage and Figure 1, as the distance between two hydrogen atoms decreases, the attractive force between the atoms:
increases only.
decreases only.
increases, then decreases.
decreases, then increases.
Check the answer here!
Answer: (C) increases, then decreases.
Watch the video explanation here!
ACT Science Practice: Scientific Investigation
In these ACT Science questions, you’ll need to understand experimental tools, procedures, and design. This involves things like identifying variables and controls, as well as comparing, extending, and modifying experiments. You’ll find them in Data Representation and Research Summaries passages. Sometimes, you may also see them in Conflicting Viewpoints passages, particularly regarding experiment design and significance.
Question 4: Easy
Subject Area: Physical Sciences
Click here for the passage!
The Big Bang theory states that the universe exploded from a single point known as a singularity and has expanded over the course of 13.8 billion years. Three scientists provide different explanations for the observed expansion rate of the universe.
Scientist 1
The universe is expanding at an increasing rate. Galaxies move away from one another as the universe expands. The light they emit is stretched by the expansion as it travels through an expanding space. The result is a shift towards the red end of the color spectrum, known as the galactic redshift. The further away from the earth a galaxy is, the greater the redshift.
Supernovae are explosions caused when massive stars collapse under their own gravity. Type 1a supernovae always release light with the same amount of intensity, which makes them useful for measuring cosmic distances because intensity is lost as their light travels through an expanding space. Comparing the color of light measured when it reaches Earth with the color at the time of the supernova explosion gives the amount of redshift and thus the distance. Distances determined by observing the redshift of type 1a supernovae confirm that the expansion of the universe is accelerating. To explain this, cosmological models need some new kind of accelerating energy—a dark energy that accelerates the expansion of the universe.
Scientist 2
The universe is not expanding at all. In our own galaxy, distant stars appear fainter and smaller, but their surface brightnesses remain constant. In contrast, the Big Bang theory tells us that, in an expanding universe, surface brightness decreases with distance. Therefore, the most distant galaxies should have much dimmer surface brightnesses than similar nearby galaxies.
But this is not supported by observations. Contrary to the predictions of the Big Bang theory, the surface brightnesses of distant galaxies are identical to nearby ones. Supernovae data confirm that galaxy distance is proportional to the redshift at all distances. The predictions of this simple formula do not need to include complex corrections for hypothetical dark matter and dark energy. The redshift of light over increasing distance must be caused by another phenomenon, one that causes the intensity of light itself to decrease as it travels through space.
Scientist 3
The supernovae data do not imply that the universe is expanding at an accelerating rate. The standard Big Bang theory is a mathematical model, not a physical portrayal of how light released from a supernova explosion disperses into an expanding universe. When a supernova explodes, its energy begins to disperse. By the time we observe the flash, the universe has become larger and more dilute. Accordingly, the intensity of light has decreased proportionally to the distance traveled. This physical portrayal explains the observed redshift values without need for a mysterious dark energy that increases the rate of expansion of the universe.
Which scientist would be most likely to predict that the expansion of the universe will be faster in the future than it is today?
Scientist 1
Scientist 2
Scientist 3
None of the scientists
Check the answer here!
Answer: (A) Scientist 1.
Watch the video explanation here!
Question 5: Medium
Subject Area: Biology
Click here for the passage!
One of the most common ways bacteria are grown in a lab is called batch culture. In batch culture, bacteria are added to a fixed amount of liquid growth media, a solution that contains nutrients for bacterial growth and allowed to grow under defined environmental conditions.
Bacterial growth in batch culture follows a predictable pattern of four phases:
1. Lag phase: Immediately after they are added to a new media bacteria must adjust their metabolism to the new environment before they begin growing and dividing. The number of bacteria in the culture does not change during this phase.
2. Log phase: Bacteria actively grow and divide, and the number of bacteria in the culture grows exponentially.
3. Stationary phase: When an essential nutrient in the media is depleted, growth slows substantially, such that growth rate in the culture becomes equal to death rate. The number of bacteria in the culture is unchanged.
4. Death phase: When culture conditions can no longer sustain any growth, bacteria die off exponentially.
Phases 2-4 will happen in every batch culture, given enough time. However, it is possible for no lag phase to be observed if little or no adjustment of metabolism is needed for the bacteria to begin reproducing in their new environment.
The following experiments was conducted to investigate the variables that affect bacterial growth in batch culture.
Experiment 1
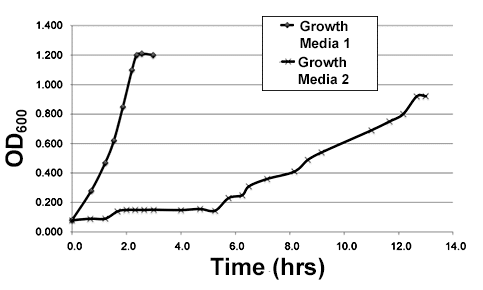
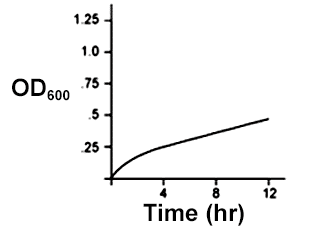
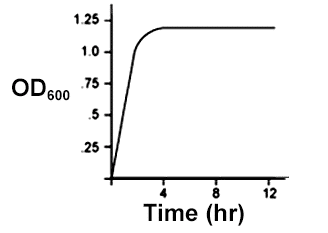
A batch culture of E. coli, a common bacterial species used for lab studies, was grown in a nutrient rich media called LB. When this culture reached log phase, 0.5 ml samples of the liquid media was removed and used to inoculate each of two 1L flasks. Each of these flasks contained a different type of liquid growth media. The new cultures were then allowed to grow at 37°C.
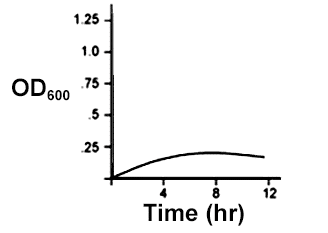
Growth of the cultures was monitored by taking periodic measurements of the optical density, or OD600, of the growth media. Optical density is a measurement of how easily light is able to pass through the media, and it is directly related to the concentration of living bacteria in the media. The resulting measurements are graphed in Figure 1.
Figure 1
Experiment 2
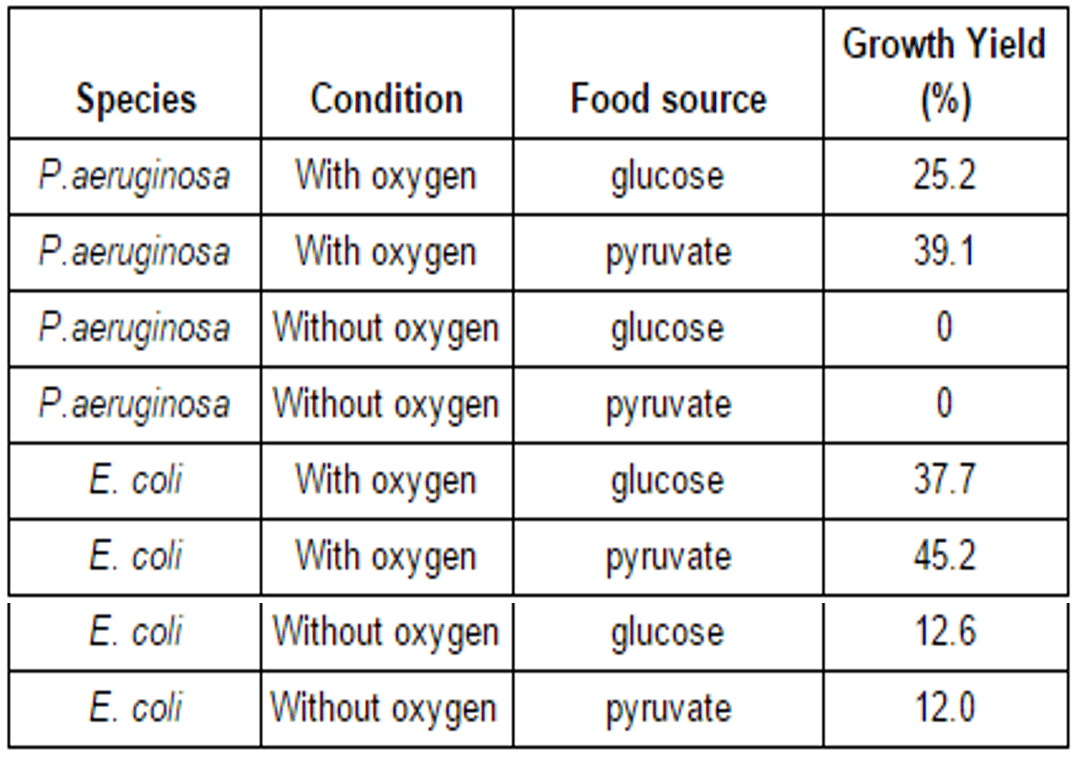
Eight 1L flasks of minimal growth media were inoculated with bacteria: four with E.coli, and four with P. aeruginosa. The flasks were then incubated at 37°C under one of two conditions–either with, or without oxygen–and OD600 measurements were taken every hour to monitor growth.
After OD600 measurements stopped rising, the bacteria was separated from the media and weighed. These measurements were used to calculate growth yield, or the percentage of carbon source(s) in the growth media that was converted to biological material. Growth yield can be used to determine how efficiently the bacteria are able to use energy during a given set of growth conditions. The results of these calculations are shown in Table 1.
Growth media can be minimal or nutrient rich. Minimal media contains only the bare minimum necessary to support growth. Nutrient rich growth media contains a wide variety of compounds used in growth, such as amino acids and vitamins. Of the two types of media tested in Experiment 1, which is more likely to be a minimal media?
Growth Media 2, because the long lag phase suggests the bacteria needed to turn on new metabolic pathways before they could begin dividing.
Growth Media 2, because bacteria divide more quickly in minimal media.
Growth Media 1, because the long lag phase suggests the bacteria needed to turn on new metabolic pathways before they could begin dividing.
Growth Media 1, because bacteria divide more quickly in minimal media.
Check the answer here!
Answer: (A) Growth Media 2, because the long lag phase suggests the bacteria needed to turn on new metabolic pathways before they could begin dividing.
Watch the video explanation here!
Question 6: Hard
Subject Area: Biology
Click here for the passage!
One of the most common ways bacteria are grown in a lab is called batch culture. In batch culture, bacteria are added to a fixed amount of liquid growth media, a solution that contains nutrients for bacterial growth and allowed to grow under defined environmental conditions.
Bacterial growth in batch culture follows a predictable pattern of four phases:
1. Lag phase: Immediately after they are added to a new media bacteria must adjust their metabolism to the new environment before they begin growing and dividing. The number of bacteria in the culture does not change during this phase.
2. Log phase: Bacteria actively grow and divide, and the number of bacteria in the culture grows exponentially.
3. Stationary phase: When an essential nutrient in the media is depleted, growth slows substantially, such that growth rate in the culture becomes equal to death rate. The number of bacteria in the culture is unchanged.
4. Death phase: When culture conditions can no longer sustain any growth, bacteria die off exponentially.
Phases 2-4 will happen in every batch culture, given enough time. However, it is possible for no lag phase to be observed if little or no adjustment of metabolism is needed for the bacteria to begin reproducing in their new environment.
The following experiments was conducted to investigate the variables that affect bacterial growth in batch culture.
Experiment 1
A batch culture of E. coli, a common bacterial species used for lab studies, was grown in a nutrient rich media called LB. When this culture reached log phase, 0.5 ml samples of the liquid media was removed and used to inoculate each of two 1L flasks. Each of these flasks contained a different type of liquid growth media. The new cultures were then allowed to grow at 37°C.
Growth of the cultures was monitored by taking periodic measurements of the optical density, or OD600, of the growth media. Optical density is a measurement of how easily light is able to pass through the media, and it is directly related to the concentration of living bacteria in the media. The resulting measurements are graphed in Figure 1.
Figure 1
Experiment 2
Eight 1L flasks of minimal growth media were inoculated with bacteria: four with E.coli, and four with P. aeruginosa. The flasks were then incubated at 37°C under one of two conditions–either with, or without oxygen–and OD600 measurements were taken every hour to monitor growth.
After OD600 measurements stopped rising, the bacteria was separated from the media and weighed. These measurements were used to calculate growth yield, or the percentage of carbon source(s) in the growth media that was converted to biological material. Growth yield can be used to determine how efficiently the bacteria are able to use energy during a given set of growth conditions. The results of these calculations are shown in Table 1.
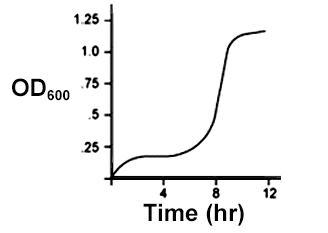
An E. coli culture in LB media growing in aerobic conditions was used to inoculate a new flask of LB media, which was then allowed to grow in anaerobic conditions. Given that E. coli uses different metabolic pathways for anaerobic conditions than it does for aerobic conditions, which of the following could be a growth curve for the the culture grown in anaerobic conditions?
Check the answer here!
Answer: (C)
Watch the video explanation here!
ACT Science Practice: Models/Experiments
In these ACT Science questions (official known as “Evaluation of Models, Inference and Experimental Results”), you’ll need judge the validity of scientific information and formulate conclusions and predictions based on that information. You’ll find them all three types of passages: Data Representation, Research Summaries, and Conflicting Viewpoints.
Question 7: Easy
Subject Area: Physics
Click here for the passage!
Electricity can be defined as the movement of electrons. Three of the most important concepts to understand in order to manipulate electricity to perform work are voltage, current, and resistance.
Voltage (measured in volts (V)) describes the amount of potential energy between two points on a circuit and is created by a difference in charge between those two points.
Current (measured in Amperes (A)) is the rate at which electrons flow through a circuit. A rate of one ampere is equivalent to 1 coulomb (a standard unit of charge) per second.
Resistance (measured in ohms (Ω)) is a measurement of how much a material resists the passage of current through the material. Materials with high resistance are referred to as insulators, while materials with low resistance are referred to as conductors.
Students in a physics course conducted several experiments to investigate the relationship between these three electrical properties.
Experiment 1
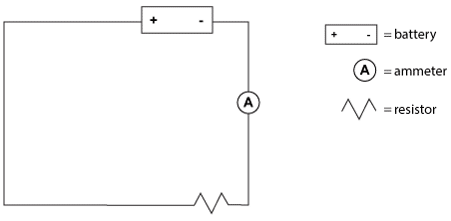
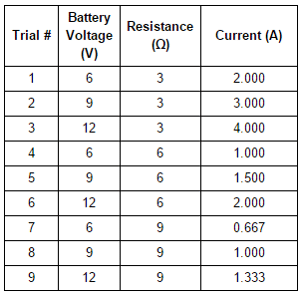
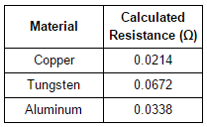
Students were provided with a variety of batteries, resistors (electrical components that resist the flow of current), and an ammeter (a device to measure current flow), along with wire and connectors. The students constructed circuits based on the circuit diagram below and measured the current in each circuit. Table 1 shows their results.
Experiment 2
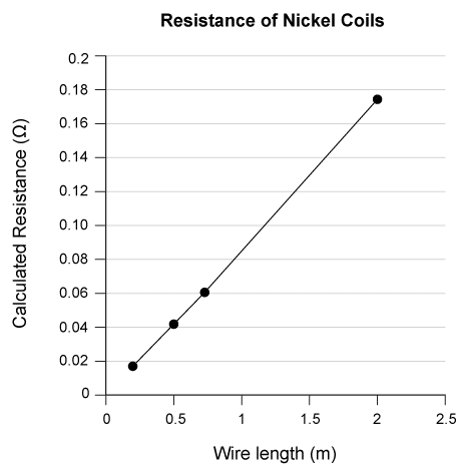
To further study the property of resistance, students replaced the resistor in their circuit with coils of nickel wire of various lengths. Students used a variable power supply to adjust voltage until current was equal to 1 A. They then used the relationship between voltage, current, and resistance determined in Experiment 1 to calculate the resistance of the wire coil. Their results are graphed in Figure 2.
Experiment 3
Students repeated the procedure from Experiment 2 using 1 meter wire coils of a variety of other metals. Their results are given in Table 2.
Experiments 1-3 were completed in a classroom at 20°C. During the previous school year, the air conditioning was broken, so the same lab was completed at 28°C. It is known that conductivity of metals decreases as temperature increases. How would the higher classroom temperature have affected the voltage required to reach 1 A in Experiment 2?
The same amount of voltage would be required.
More voltage would be required.
Less voltage would be required.
It is impossible to determine from the information provided.
Check the answer here!
Answer: (B) More voltage would be required.
Watch the video explanation here!
Question 8: Medium
Subject Area: Physical Sciences
Click here for the passage!
Highly refined and purified mineral oil fractions are widely used for elaboration of consumer products such as foods and cosmetics. These mineral oils (MO) are called “white oils” and must meet very strict criteria in terms of residual levels of mineral oil aromatic hydrocarbons (MOAH). Reliable methods for detecting and monitoring the total MOAH levels in MO are needed to optimize the MOAH removal processes in white oil production.
A novel detector has been introduced, the Vacuum Ultraviolet (VUV) detector. This detector is used in combination with a gas chromatograph (GC) and measures the absorbance of gas phase compounds in the far UV wavelength range from 120 to 430 nm. At low wavelengths, all aliphatic and aromatic compounds are detected, and at higher wavelengths, only the aromatic and unsaturated compounds are detected. Given that the VUV spectra of compounds can differ significantly depending on the different functional groups present in the molecule, the detector is able to quantify MOAH levels in mineral oil without requiring prior separation from mineral oil saturated hydrocarbons (MOSH), which makes the VUV an improvement upon earlier detection methods. Figure 1 shows VUV absorbance spectra of select aliphatic and aromatic compounds containing the typical structural elements of MOSH and MOAH compounds, respectively.
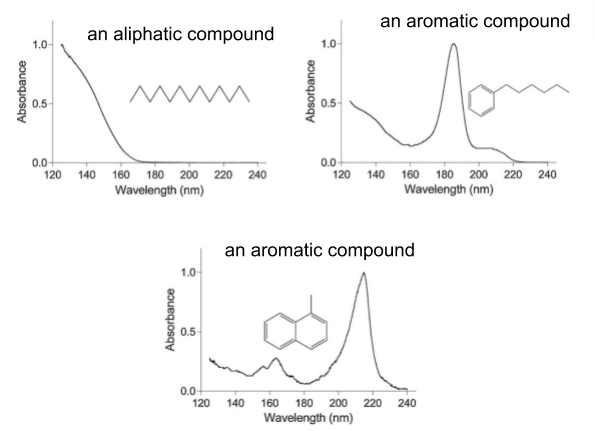
Figure 1
Study 1
To study the spectral differences between actual MOSH and MOAH fractions, eight different mineral oil samples were separated using the traditional Solid Phase Extraction (SPE) method. Figure 2 shows the overall averaged VUV absorbance spectra obtained for the MOSH and MOAH fractions from these 8 oils.

Figure 2
Study 2
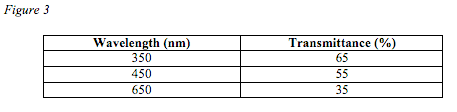
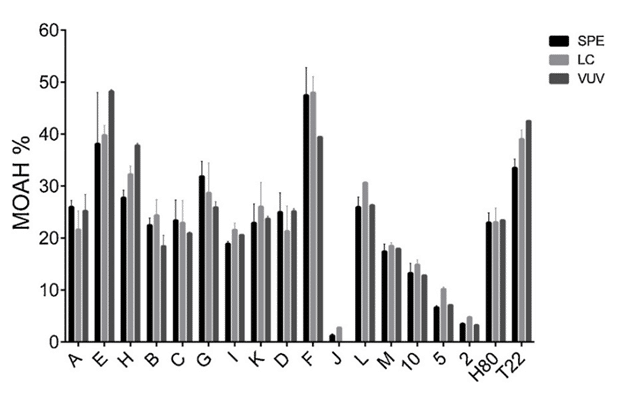
To determine the practical application limits of the newly proposed rapid VUV method for MOAH analysis, a series of starting samples and intermediates of white oil production of different origins and MOAH levels were analyzed and compared with data from two standard detection methods: Solid Phase Extraction (SPE) and Liquid Chromatography (LC). The VUV and LC methods were used in conjunction with Gas Chromatography. Figure 3 shows the MOAH content obtained from 18 different mineral oil samples.
Suppose the VUV spectrum of an unknown mineral oil is obtained and displays significant absorbance only above 200 nm. Based on the information provided, the unknown mineral oil would have contained:
both MOAH and MOSH compounds.
only MOAH compounds.
only MOSH compounds.
neither MOAH nor MOSH compounds.
Check the answer here!
Answer: (G) only MOAH compounds.
Watch the video explanation here!
Question 9: Hard
Subject Area: Chemistry
Click here for the passage!
Lauric acid is the main fatty acid in coconut oil and is currently being studied for potential health benefits. This white, powdery substance remains solid at room temperature (23°C). To investigate the physical properties of lauric acid, students added 15 g of lauric acid and 15 g of water to a test tube and placed it in a 60°C water bath (see Figure 1) to melt the sample.
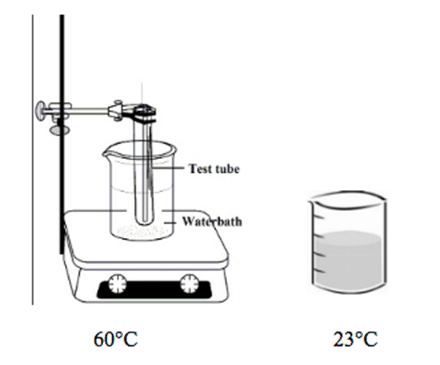
Figure 1
Part A
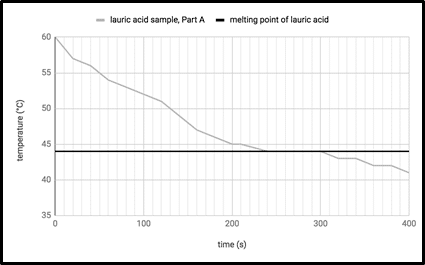
When the test tube registered 60°C, the students removed the test tube from the heated beaker and placed it in a second water bath that was 23°C (see Figure 1). They recorded the temperature of the sample every 20 seconds until the sample solidified. Results are shown in Figure 2.
Figure 2
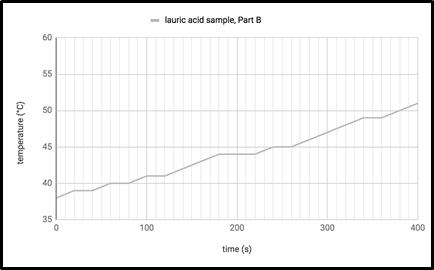
Part B
When the lauric acid sample reached 38°C, the students removed it from the 30°C water bath and placed it back in the 60°C bath. They recorded the temperature every 20 seconds for 400 seconds. The results are shown in Figure 3.
Figure 3
Which of the following conclusions is best supported by the experiment?
It takes less time for lauric acid to cool from 50°C to 45°C than it takes for lauric acid to warm from 45°C to 50°C.
It takes less time for lauric acid to warm from 40°C to 45°C than it takes for lauric acid to cool from 45°C to 40°C.
Under constant temperature conditions, lauric acid cools more quickly between temperatures 55°C and 50°C than between 50°C and 45°C.
Under constant temperature conditions, lauric acid cools more quickly between temperatures 50°C and 45°C than between 45°C and 40°C.
Check the answer here!
Answer: (D) Under constant temperature conditions, lauric acid cools more quickly between temperatures 50°C and 45°C than between 45°C and 40°C.
Watch the video explanation here!
ACT Science Practice Questions: An Important Takeaway
How did you do on these practice ACT Science questions? If you’re struggling with a particular problem, take a look at the video explanation (make sure to scroll down to see the video). Think about which tip from the above list might apply. Then, work on similar problems in the same category so you can ensure you improve your score as much as possible!
See what we did there? In your test prep, as you practice ACT Science problems, the key is to figure out why you answered questions wrong. Is Interpretation of Data giving you trouble? Maybe it’s Scientific Investigation. Or maybe Models/Experiments questions stump you.
It can feel frustrating to master each problem type at first. But each time you sit down to review what you got wrong—and why—in ACT Science questions, you’re building knowledge that will help you on test day. It’s the best way to improve your ACT score—and a great way to help you get into your dream college.
At the end of the day, there’s only one piece of advice that really matters: keep going! You can do it!


Leave a Reply