Your graphing calculator in an invaluable resource on your AP Calculus exam, and can be a lifesaver if you know how to use it well. It will allow you to solve questions quickly, find roots of equations, easily determine derivatives, find the minimization of functions, determine definite integrals, examine the shape of curves, and easily find the intersection of equations. It is not allowed on every section, but is required on a little under half the exam. Knowing good calculator strategies can help you immensely on the exam.
Which calculator should I get?
There are many calculators currently available. You can find older (see TI-83 and TI-84s) versions that have been around for almost 20 years as well as newer versions that have touch screens and can perform much more complex tasks. There are pros and cons to each. The simplicity of the older ones makes them easier to learn with, leading to less wasted time jogging through menus and options. The newer ones can solve fancy integrals and differential equations.
One of the key strategies is to choose one version early in the year, and use the same calculator for the entire year. By the time you get to the AP Exam, the last thing you want to be worried about is figuring out the details of your calculator. You want to know the machine inside and out, and make sure that every key stroke is second nature. These calculators can do amazing things, but you do not want to be searching through menus to figure out how to take an inverse of a trigonometric function, or to figure out how to take logarithms, or find the minimum on a graph. Every part of the calculator that you might use on the AP exam should be very familiar by the time you get there.
Calculator strategies for the AP Calculus Exam
Besides the basic functions that these calculators share with scientific calculators, you should practice working with the graphing functions.
Choosing an appropriate window size
When graphing a function, you need to have an idea of what the function should look like. For instance, let us take a basic example. Imagine the equation ? = (x – 10)2 − 20. You should have an idea that this is a parabola with a vertex of (10, -20), and two roots. However, if you quickly graph this in a standard window on your calculator, you would see something that might be quickly confused with a linear function. Depending on what you’re trying to do, this could lead to mistakes or missing solutions.
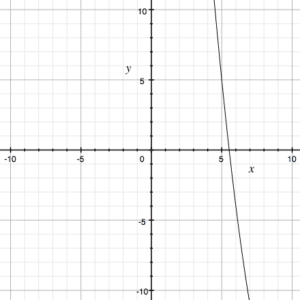
Know how to resize your window both manually and using the automatic window sizing functions on your calculator.
Roots and Intersections
You should be able to determine the number of roots and the number of real roots a function should have, and where these roots exist.
Firstly, the degree of a polynomial tells us the number of roots. Let us take y =x3-3x-3. This is a 3rd-degree polynomial, or a function with 3 roots. However, knowing nothing else about this function, we do not know how many real roots it has. Imaginary roots always come in pairs, so this function might have 3 real roots, and 0 imaginary roots, or 1 real root, and 2 imaginary roots, but it cannot have 3 imaginary roots. The graph should be able to tell us more:
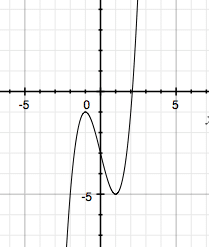
Notice the graph has a local maximum below the y-axis. Since the slope of the curve changes direction twice without crossing the x-axis, we know complex roots exist.
Here we have the function y = x3-3x-1. We can see the function cross the x-axis 3 times, and therefore we know we have 3 real roots.
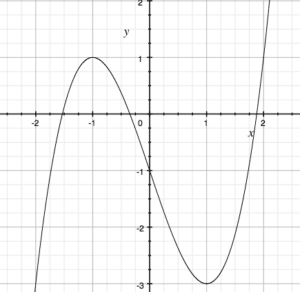
Different calculators have different ways of finding these roots. Make sure you are able to use your calculator to find the roots of a function.
Minimums and Maximums
You should be able to calculate the minimums and maximums of graphed functions. Different calculators do this in different ways. As well, the shape of the graph should tell you if the point you found is a local or absolute minimum or maximum.
If we look at the example above, y = x3-3x-1, we can see that both x=-1 and x=1 produce a local maximum and a local minimum. Although since the graph goes to negative infinity on the left, and positive infinity on the right, we know that these are not absolute minimums and maximums (an odd degree polynomial ALWAYS has a range of negative infinity to positive infinity).
Solving Multiple Equations
Sometimes it is necessary to solve for the solution set of multiple equations. There are many ways of doing this on graphing calculators (some modern calculators have programs built in for this), but often the easiest way is to graph the two (or more) equations and find the intersection. Note, this only works for 2 variable equations.
Let us find the solution to:

Graphing the two equations gives us
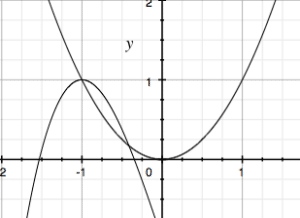
We see that there are two intersection points. Your calculator will be able to easily find what these two points are, giving us the solution set to our system of equations.
Graphing calculators are invaluable tools. Different models have a wide variety of abilities. You can easily do well on the AP exam with the simplest of graphing calculators, but the important thing to remember is that you need to know what your calculator is able to do, and how to do it before you get to the AP exam. The exam itself is not the time to be searching through menus on your calculator or wondering if it will be able to solve an equation. By the time the exam comes around, everything you plan on using your calculator for should be second nature.


