The limit of a function may be a confusing concept. What do we mean when we say that a function has a limit at a given point? And how can we estimate or compute limits?
Limit problems show up on both the AP Calculus AB and BC exams, so it’s important to understand the concepts and techniques in order to maximum your score. In this article I’ll define the limit of a function and illustrate a few techniques for evaluating them.
Definition: the Limit of a Function
Suppose y = f(x) is a function. Informally, a limit of f is a y-value L that f(x) approaches as x approaches some specified number a. We use the following notation for limits:
![]()
Graphical Interpretation of Limits
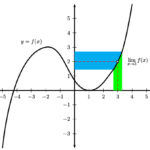
Let’s take a look at the graph below. What is going on near x = 3?
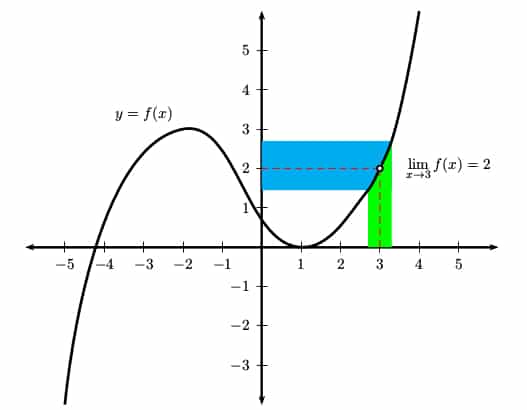
The open circle on the graph at (3, 2) means that f(3) does not exist. However the limit does exist!
Notice that any x-value in the green region has a corresponding y-value in the blue region. As long as x is chosen close enough to 3 (but not 3 itself), the output of f(x) can be made to be as close as we want to 2.
Therefore the limit of f(x) as x → 3 is equal to 2.
Estimating a Limit
I tend to think of limits as measuring the “trend” of the function values. One way to estimate a limiting value is to build a table of values. Choose x-values that are closer and closer to x = a, and look for a trend in the corresponding y-values.
For example, let’s estimate ![]() , using a table of values.
, using a table of values.
First of all, note that if you plug in x = 3, you get: (32 – 3(3))/(32 – 9) = (9 – 9)/(9 – 9) = 0/0. We all know you can’t divide by 0. So does that mean the limit doesn’t exist?
No, the limit might still exist! In fact, a limit problem is not really asking for the actual value of f at x = a. Instead, it’s about what happens near x = a.
So since we can’t plug in 3 directly, we should examine the output of the function for x-values near 3. For example, try plugging in 2. But there are infinitely many numbers that are even closer, including 2.9, 2.99, 2.999, so let’s check those out too.
| x | f(x) = (x2 – 3x)/(x2 – 9) |
|---|---|
| 2 | 0.4 |
| 2.9 | 0.491525 |
| 2.99 | 0.499165 |
| 2.999 | 0.499917 |
| 3 | Can’t plug in |
The corresponding y-values seem to be heading towards 0.5.
A number close to 3 on the right would be 4. But that might not give the most accurate estimate, so try 3.1, 3.01, 3.001, approaching 3 from the right. It is important to sample many values both to the left and right of your a-value so that you can build evidence to support your estimate for the limit.
| x | f(x) = (x2 – 3x)/(x2 – 9) |
|---|---|
| 4 | 0.571429 |
| 3.1 | 0.508197 |
| 3.01 | 0.500832 |
| 3.001 | 0.500083 |
| 3 | Can’t plug in |
Even though you can’t plug in 3, the trend in the function values seems to be point towards a limiting value of 0.5.
Next Steps
Finding a limit from the graph or from numerical evidence may not give the precise limit value. In fact, a table of values may even mislead you to think that a function has a limit when it does not. So it’s essential to have a toolbox of methods for working out limits analytically.
In this short introduction we cannot explore those techniques, but now that you know what a limit is, take a look at the following resources:


