Boxplots are one data format you may see on the GRE Data Interpretation questions. First, try these practice questions.
(The following diagram applies to questions #1-3)
The following boxplot shows the 2012 season runs batted in (RBIs) of 280 American League batters (the top 280 batters in terms of number of plate appearances).
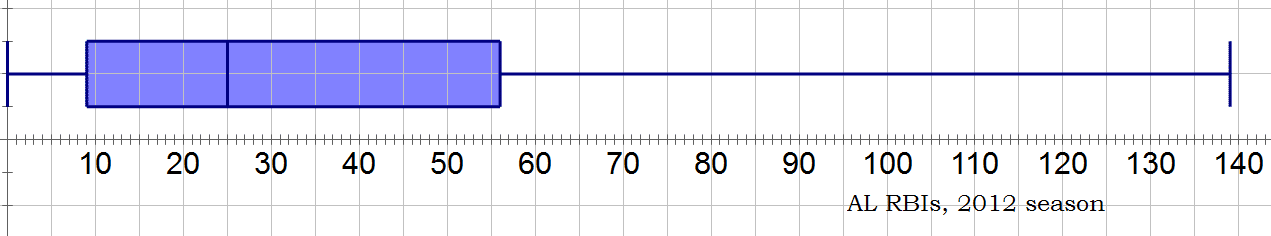
1) What is the size of the IQR of this distribution?
- 25
- 47
- 56
- 83
- 140
2) How many AL hitters hit more than 25 RBIs in 2012?
- 9
- 56
- 83
- 114
- 140
3) B. J. Upton of the Tampa Bay Rays hit 78 RBIs in 2012; this is the 90th percentile value on this chart. How many players hit between 56 and 78 RBIs?
- 14
- 22
- 28
- 34
- 42
(BTW, that max value of 139 RBIs is Miguel Cabrera, after his extraordinary Triple Crown year.)
Five-number summary
In this previous post, I discussed the idea of quartiles and IQR, tools that statisticians use to “chunk” a data set. Sometimes, statisticians add to this the median & minimum & maximum to create something called the “five-number summary”
1. maximum
2. third quarter, Q3, the 75th percentile
3. median, 50th percentile
4. first quartile, Q1, the 25th percentile
5. minimum
The beauty of the five-number summary is that it divides the entire data set into quarters — between any two numbers on the five-number summary is exactly 25% of the data.
A visual approach
Because statisticians, like all human beings, are highly visual folks, they created a visual way to display the five-number summary. This visual form is called a boxplot. Boxplots were created by the brilliant statistician John Tukey in 1977. The five vertical lines represent the five numbers of the five-number summary, and the “box” in the middle, from Q1 to Q3, represents the IQR, i.e., the middle 50% of the data. Between any two adjacent vertical lines are 25% of the data points.
Strikeouts
Here’s an example of a boxplot using real baseball data. The data here are the 2012 season total for strikeouts pitched (by all National League pitchers who pitched at least 75 innings in the season).
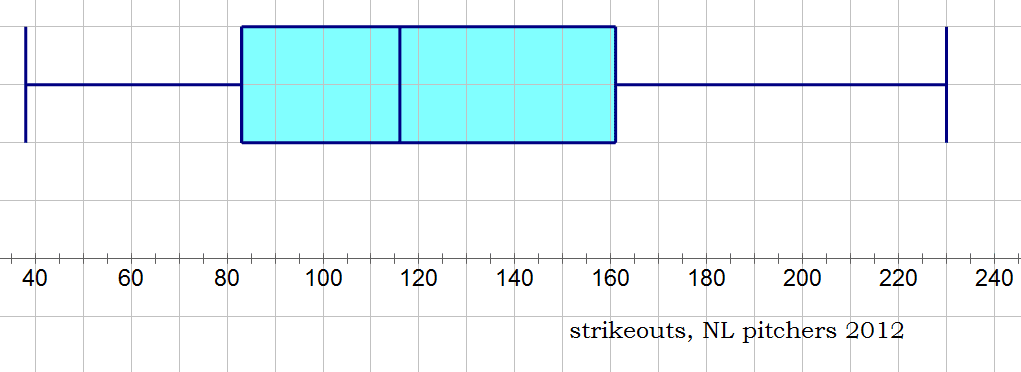
Half of all the NL pitchers here pitched between Q1 = 83 and Q3 = 161 strikeouts in the year — these are the pitchers in the IQR, the big blue box in the center. Only 25% of the pitchers in this group struck out fewer than 83 batters— this “bottom 25%” is on the “lower arm”, from 38 to 83. Only 25% of these pitchers struck out more than 161 batters in the 2012 season —- this “top 25%” is on the “upper arm”, from 161 to 230. (BTW, that maximum value, 230 strikeouts, is R. A. Dickey, the knuckleball star pitcher of the NY Mets!) On a Data Interpretation question, ETS could give you a boxplot and expect you to read all the five-number summary information (including percentiles) from it.
If you found the practice questions difficult the first time around, you may want to go back and give them another look, before you read the solutions below.
Practice questions explanations
1) The IQR is the distance from Q1 to Q3. From the boxplot, we read that Q1 = 9 and Q3 = 56, and the difference between them is 56 – 9 = 47. Answer = B
2) From the boxplot, we read that 25 RBIs is the median, so that number divides the list in half. There are 280 hitters on this list: half must be above the median, and half below. Therefore, there are 140 hitters above the median value of 25 RBIs. Answer = E.
3) Upton, at 78 RBIs, is the 90th percentile. From the boxplot, we read that 56 RBIs, is Q3, i.e. the 75th percentile. Between the 75th percentile and the 90th percentile is 15% of the list. There are 280 hitters on the list, so 15% of 280 = 0.15*280 = 42. There are 42 hitters between 56 RBIs and 78 RBIs. Answer = E.