When it comes to IELTS writing task 1, 25% of your marks are for the range of words you use. That means IELTS graph vocabulary is a very important component to review as you prepare for the Writing Task 1. You can start by checking out this IELTS writing task 1 vocabulary guide. And below, I’ll provide an overview of words and useful phrases to incorporate into your writing so that you can get top marks on the lexical resource category and a high band score overall. Basically, the better your IELTS writing chart vocabulary, the higher score you’ll get. It’s not hard, but there is a clear formula to doing well.
How to Use IELTS Graph Vocabulary in Writing Task 1
Because IELTS writing task 1 involves describing a graph or chart of some type, it will help to have a handle on IELTS writing chart vocabulary — words and phrases that help you write about the information on the chart or graph.
How are graphs described in IELTS? Let’s walk through the best vocabulary for the task, step by step.
1. Start With Introduction Phrases
Often ESL students start their essay with ‘The graph shows…’. While this is fine, the verb ‘shows’ could be replaced by a more exciting and high-level vocabulary word. Here are four different prompts to start your essay:
- The graph illustrates the trends in…
- The graph reveals information about the changes in…
- The graph provides the differences between…
- The graph presents how X has changed over a period of…
- DO NOT write the word below or above in your introduction. i.e. The graph above/below shows…
2. Add Suitable Adverbs
Adverbs help express a relation of place, time, circumstance, manner, cause, and degree, and can greatly add some color and interest to your writing as well as show off your range of vocabulary. Unlike adjectives (which describe nouns), adverbs describe verbs, or actions. Here’s a great list of adverbs to use:
| Adverb | Meaning |
|---|---|
| Approximately | Almost, but not completely exact; roughly |
| Dramatically | By a quick and large amount |
| Erratically | In a way that is uneven or irregular |
| Gradually | By slow degrees |
| Markedly | Noticeably, significantly |
| Significantly | In a way that is worthy of attention; importantly |
| Slightly | To a small degree |
| Slowly | At a slow speed, not quickly |
| Steadily | In a regular or even way |
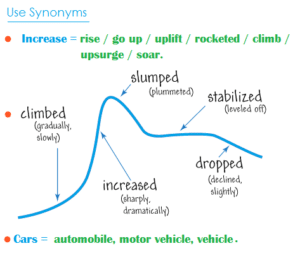
3. Use Appropriate Synonyms
Again using a variety of nouns and verbs for words like rise and fall will help increase your overall score. Here are some suggestions:
| Rise (Noun) | Rise (Verb) | Fall (Verb) | Fall (Noun) | Fluctuate (Verb) |
|---|---|---|---|---|
| Climb | Increase | Collapse | Decline | Be erratic |
| Increase | Climb | Decline | Decrease | Be fitful |
| Improve | Leap | Decrease | Deterioration | Vary |
| Jump | Pick up | Deteriorate | Dip | Rise and fall |
| Leap | Surge | Dip | Drop | |
| Move upward | Growth | Drive | Plunge | |
| Rocket | Drop | Freefall | ||
| Skyrocket | Go down | Slide | ||
| Soar | Plummet | Slip | ||
| Shoot up | Plunge | Dive | ||
| Pick up | Slide | Reduction | ||
| Surge | Slip (back) | Slump | ||
| Recover | Slump | |||
| Take a nosedive |
4. Add Time Phrases
Below are some excellent time phrases with sentence examples:
| Time Phrase | Example Sentence |
|---|---|
| Between…and | Between 1982 and 1992 there was a steady drop. |
| From…to | From 1992 to 1996 there was a dramatic increase. |
| In the year… | In the year 2020, unemployment spiked. |
| During/over the period | During the 1980s, trends stayed consistent. |
| over the latter half of the year/century/decade/period | Over the latter half of the century, more women entered the workforce. |
| over the next/past/previous… | Over the previous year, work-from-home rates sharply increased. |
| days/weeks/months/years/decades | For several weeks, stock prices have remained stable. |
| by… | By 1997, market growth had stabilized. |
Using IELTS Graph Vocabulary in a Model Essay
Look at the sample IELTS writing Task 1 graphs on the British Council website. Below is my model answer with useful words in bold:
The bar charts illustrate the trends in computer ownership, with a further classification by level of education, from 2002 to 2010.
Over the period, it can be observed that there was a significant surge in the percentage of the population that owned a computer. In the year 2002, only about 58% of the population owned a computer, whereas by 2010, this gradually increased to where over three-quarters of individuals had a home computer.
Looking at the information by level of education reveals that higher levels of education correspond to higher levels of computer ownership in both of those years. In 2002, a significantly low percentage of the population who did not finish high school had a computer, but this figure skyrocketed by 2010, going from 15% to over 40%. There were also dramatic climbs, of approximately 30 percentage points, for those with a high school diploma or an unfinished college education (reaching 65% and 85%, respectively, in 2010).
To conclude, during the last decade, there has been a substantial growth in computer ownership across all educational levels.
Other IELTS Graph Vocabulary Resources
Keep in mind that IELTS writing task 1 may contain one of several different types of infographic: a bar chart, pie chart, line graph, diagram, etc. Regardless of the type, you’ll want to have a good handle on IELTS writing chart vocabulary.
For more specific guides to the different kinds of graphs, charts, and graphics you may find on IELTS writing task 1, check out the following resources:
- How to Describe a Bar Chart
- How to Describe a Pie Chart
- How to Describe a Map
- How to Describe a Process Diagram
You can also check out Magoosh’s IELTS linking words PDF for transitions between ideas. Hopefully you’ll start to incorporate some of these key words and phrases, as well as the above suggestions, in your IELTS Task 1 Writing. If you still don’t feel comfortable doing so, consider dedicating more time to your IELTS studies with Magoosh’s fun, engaging IELTS prep for extra practice.