
This IELTS Academic Writing Task 1 question type might make you a little hungry. That’s because we’re going over pie charts today! To help give you an idea of what to expect and how to write a response, let’s look at this pie chart practice question with a model band 9 essay.
To see why this essay is band 9, see our Band 9 essay with scorer commentary, and check out the official IELTS rubric for Task 1 (PDF).
This particular prompt is a pie chart. Your approach to this chart should be the same as your approach to any other Task 1 infographic Take a look at the information and think carefully. What is the best way to summarize the way the information is structured and the main points? From there, how can you best compare the most relevant pieces of information? Finally, how should you structure that summary and comparison? For more advice on how to approach this, see our article on IELTS Academic Task 1 paragraph structure, as well as our main page for IELTS sample questions and practice resources.
Try to do this prompt yourself. Then check out our band 9 model essay below the prompt and compare it to your own work to see how you did.
Model IELTS Academic Writing Task 1 Prompt: Pie Chart
The chart below gives information about the household percentage of spending on essential goods in China for the years 1995 and 2011
Summarise the information by selecting and reporting the main features and make comparisons where relevant.
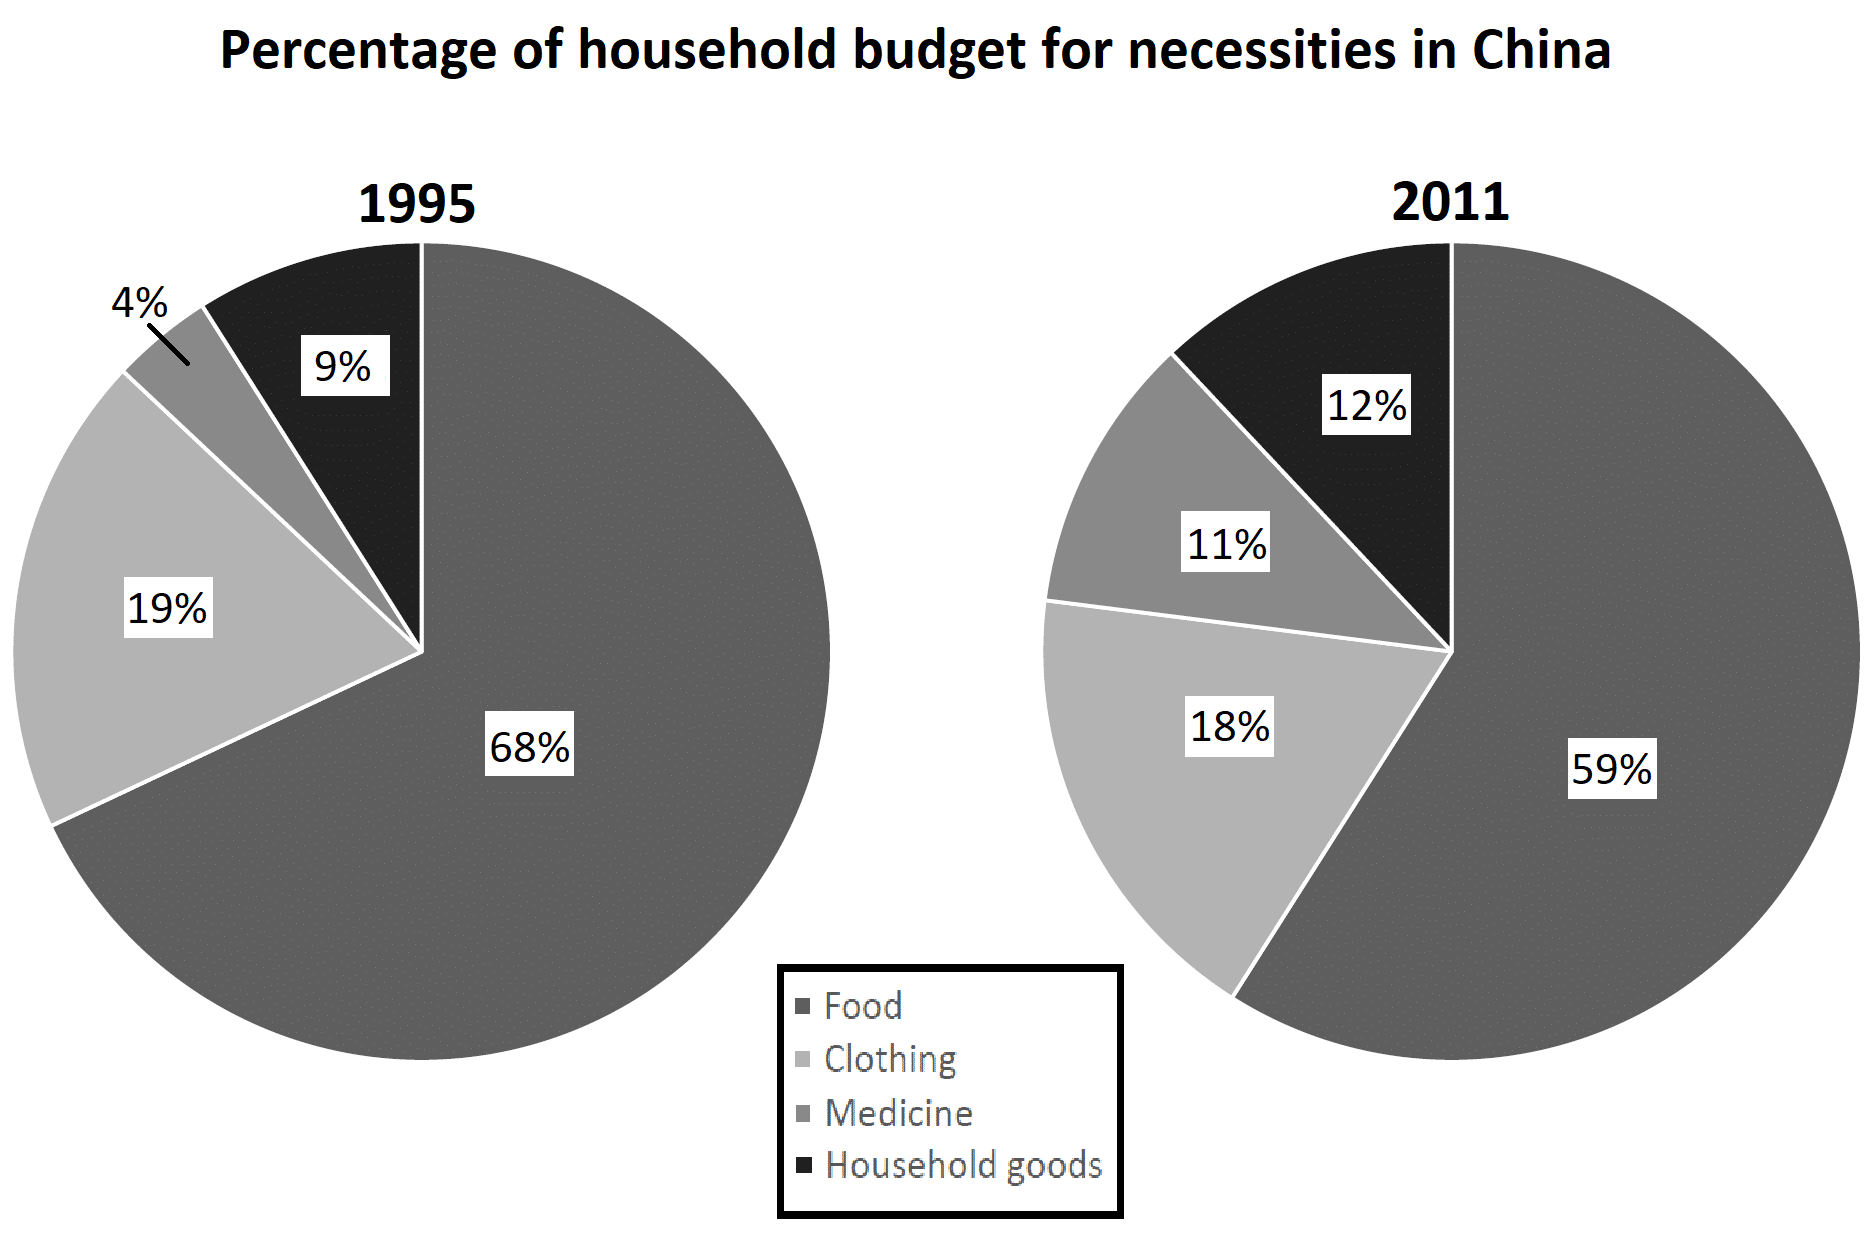
The two pie graphs show differences in Chinese household spending in four essential categories. These categories are marked as percentages of total spending, with differences in spending for 1995 and 2011.
Food and clothing remained the largest categories in both years, with medicine and household goods remaining the smallest. Nonetheless, there were measurable changes in all four categories over the years. Changes to the household budget shares of food and medicine were particularly noticeable.
Both of the top two categories, clothing and food, shrank during this 16 year period. Clothing lost just 1% of its share, going from 19% to 18%, while food dropped more dramatically, starting at 68% but losing 9 points of share by 2011.
In both 1995 and 2011, medicine and household goods represented the lowest and second-lowest spending categories, respectively. Still, both gained a larger share of household spending in China by 2011. Medicine jumped 7 points from 4% to 11%, while household goods made a smaller but still-noticeable increase from 9 to 12 percent.
More Practice IELTS Academic Writing Task 1 Sample Questions and Model Essays
- IELTS Academic Writing Task 1: Process Diagram with Model Answer
- IELTS Academic Writing Task 1: Bar Chart With Model Answer
- IELTS Academic Writing Task 1: Map With Model Answer
- IELTS Academic Writing Task 1: Line Graph with Model Answer
- IELTS Academic Writing Task 1: Comparing two Graphics with Model Answer
And don’t forget to use Magoosh’s complete guide to IELTS Writing.