

IELTS Academic Writing Task 1 questions sometimes come with two graphics, which you’ll be asked to analyze. Let’s take a look at a practice Writing Task 1 question, with an accompanying model band 9 essay, for this question type.
To see why this essay is band 9, see the scorer commentary section in this article, right below the sample essay itself. Also be sure to and check out the official IELTS rubric for Task 1 (PDF). The scorer commentary is based on this rubric.
This particular prompt is a dual graphics prompt, where two different graphics (in this case a line graph and a table) are presented together. Your approach to this set of images should be the same as your approach to any other Task 1 infographic. Take a look at the information and think carefully. What is the best way to summarize the way the information is structured and the main points? From there, how can you best compare the most relevant pieces of information? Finally, how should you structure that summary and comparison?
For more advice on how to approach this, see our article on IELTS Academic Task 1 paragraph structure, as well as our main page for IELTS sample questions and practice resources. Try to do this prompt yourself. Then check out our band 9 model essay below the prompt and compare it to your own work to see how you did.
Model IELTS Academic Writing Task 1 Prompt: Compare Two Different Types of Graphics
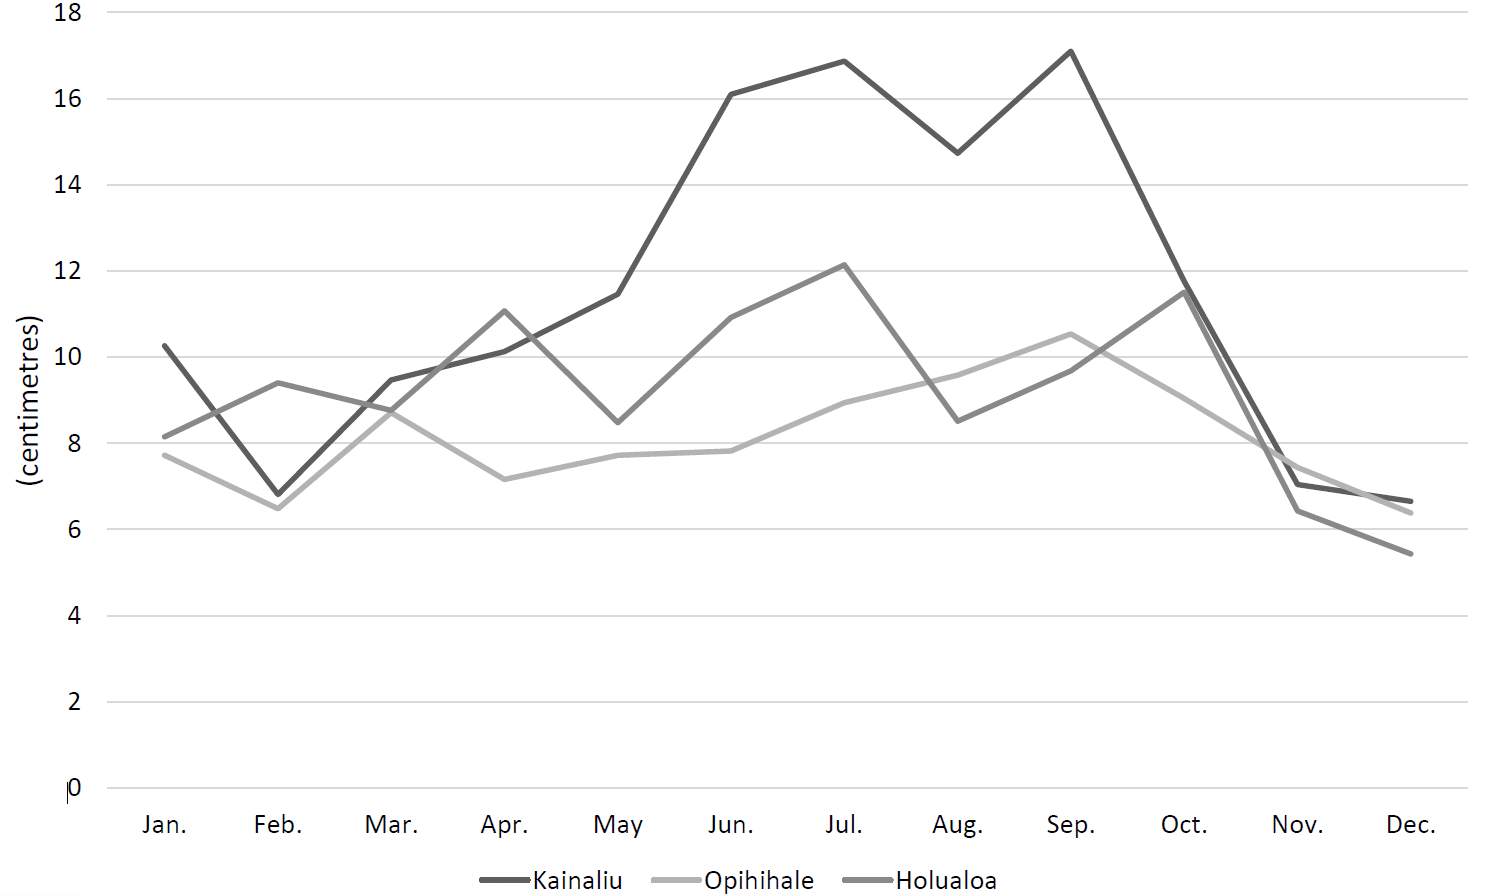
The graph and table below show the average monthly rainfalls and average annual rainfalls for three towns in the district of Kona in Hawaii for a 30-year period (1971-2000).
Summarise the information by selecting and reporting the main features and make comparisons where relevant.
| TOWN | AVERAGE ANNUAL RAINFALL (1971-2000) |
|---|---|
| Kainaliu | 138.38 |
| Opihihale | 97.53 |
| Holualoa | 110.48 |
Model Essay (with scorer commentary)
The chart and table show the average monthly and annual rainfall for the towns of Kanaliu, Opihihale, and Holualoa from 1971 to 2000.
Average monthly rainfalls are usually higher from June to September and tend to be lower between October and May. However, rainfall can differ a good deal between towns, and these differences add up to distinctly different annual numbers.
Opihihale usually has the least rainfall but has slightly more (less than 2 cm difference) rainfall than the Holualoa around August, and slightly more than both towns for a time in November. In contrast, Kainaliu’s monthly rainfall is often the highest, 7-9 cm greater than Opihihale and 5-7 cm greater than Holualoa at the height of the summer and fall rainy periods.
The larger differences during the higher rainfall periods add up over the course of the year. In the table, Kainaliu clearly has the most annual rainfall, Opihihale has the least by far, and Holualoa sits between these two extremes, somewhat closer to Opihihale than to Kainaliu.
Scorer Commentary (Comparing Two Graphics, Band 9)
The score report below is based on the official IELTS Writing Task 1 rubric. This report also looks very similar to the Magoosh IELTS essay scoring service.
Overall Band Score: 9
| CATEGORY | Task Achievement/Response | Coherence and Cohesion | Lexical Resource | Grammatical Range and Accuracy |
|---|---|---|---|---|
| SCORE | 9 | 9 | 9 | 9 |
What was done well in the essay:
- This essay has 161 words, more than the 150 minimum. Always make sure you exceed that 150 mark, so you can avoid the IELTS Writing word count penalty.
- The essay covers all the major details seen in the two infographics, describing the overall trends that apply to all three towns. It also covers month-to-month and annual differences, as well as differences between the towns.
- The paragraphs are neatly divided by topic, with a first paragraph overview, followed by a paragraph on overall trends, followed by a paragraph on monthly averages and a paragraph on annual rainfall.
- Great use of transitional phrases such as “however” and “in contrast,” as well as referential phrasing like “these differences” and “in the table.” This clearly illustrates the relationship between different ideas and different pieces of data.
- The vocabulary and grammar works well here. There are no serious errors, and there is a good variety of word choice and sentence structure so that nothing feels repetitive.
More Practice IELTS Academic Writing Task 1 Sample Questions and Model Essays
- IELTS Academic Writing Task 1: Process Diagram with Model Answer
- IELTS Academic Writing Task 1: Bar Chart With Model Answer
- IELTS Academic Writing Task 1: Map With Model Answer
- IELTS Academic Writing Task 1: Line Graph with Model Answer
- IELTS Academic Writing Task 1: Pie Chart with Model Answer
After you’re done with those, make sure you practice other aspects of Writing Task 1, and prepare for the IELTS Writing section as a whole. This collection of IELTS Writing resources can help.


Leave a Reply