Wondering what to expect when it comes to bar charts on IELTS Academic Writing Task 1? Let’s examine a practice bar chart question with a model band 9 essay.
To see why this essay is band 9, and check out the official IELTS rubric for Task 1 (PDF). Then take a look at the scorer commentary that appears right underneath the model essay itself.
This particular prompt is a bar chart. Your approach to this chart should be the same as your approach to any other Task 1 infographic. Take a look at the information and think carefully. What is the best way to summarize the way the information is structured and the main points? From there, how can you best compare the most relevant pieces of information? Finally, how should you structure that summary and comparison?
For more advice on how to approach this, see our article on IELTS Academic Task 1 paragraph structure, as well as our main page for IELTS sample questions and practice resources.
Try to do this prompt yourself. Then check out our band 9 model essay below the prompt and compare it to your own work to see how you did.
Model IELTS Academic Writing Task 1 Prompt: Bar Chart
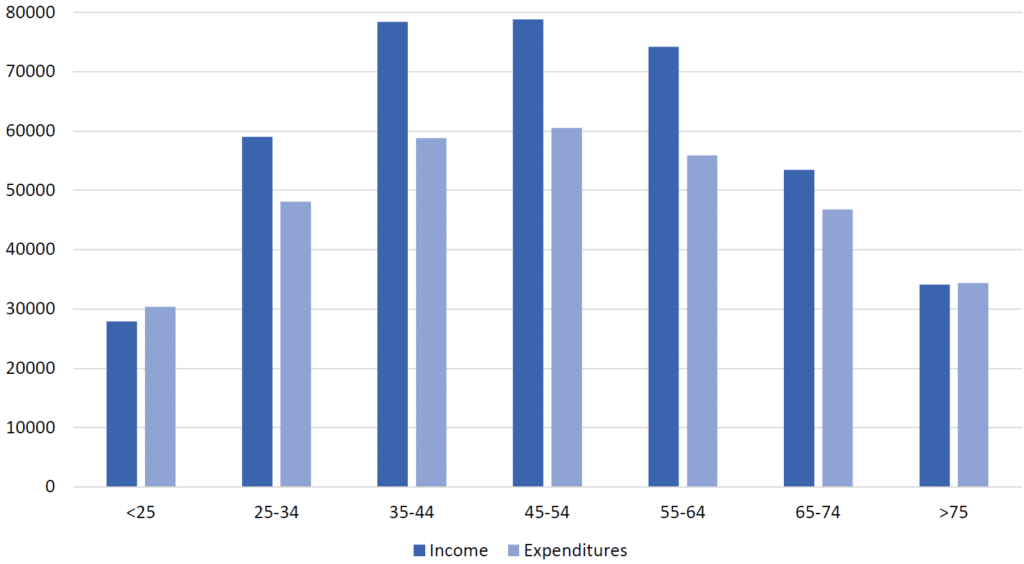
The chart below gives information about the ratio of income to spending (in dollars) by Americans by age range in 2013.
Summarise the information by selecting and reporting the main features and make comparisons where relevant.

Model Essay
This graph compares how much Americans spent to how much income they made in 2013, by age group.
The data shows an overall rise and fall in both income and spending between young, middle-aged, and older Americans. Income rises and falls more sharply than spending.
Those under 25 and over 75 actually spent slightly more than they earned. In contrast, between the ages of 25 and 64, Americans earned 10,000 to 20,000 dollars more than they spent. This difference shrinks in the 65-74 age group, where spending was just a few thousand dollars less.
In terms of actual numbers, those under 25 or over 75 earned and spent around 30,000 and 35,000 dollars, respectively. 25-34 year-olds and 65-74 year-olds both earned in the 50,000s and spent in the 40,000s. In the middle, between ages 35 and 64, income was 70,000-80,000 dollars, and spending ranged from roughly 55 to 60 thousand.
Scorer Commentary (Bar Chart, Band 9)
The score report below is based on the official IELTS Writing Task 1 rubric. This report also looks very similar to the Magoosh IELTS essay scoring service.
Overall Band Score: 9
| CATEGORY | Task Achievement/Response | Coherence and Cohesion | Lexical Resource | Grammatical Range and Accuracy |
|---|---|---|---|---|
| SCORE | 9 | 9 | 9 | 9 |
What was done well in the essay:
- This essay is borderline risky when it comes to word count. But it still manages to sit at 158 words, just above the exact 150 word minimum. So the writer has managed to avoid the IELTS Writing word count penalty.
- The response includes all important details listed in the instructions. The basic topic of the grpah (debt to income for different age groups) is stated, followed by an overview of the tends, and some detailed comparisons of specific age groups and income levels.
- Each aspect of the essay gets its own paragraph, with a paragraph for the basic purpose of the graph, a paragraph for overall trends, and so on. This helps to clearly divide each different type of important information.
- Transitions and referential phrases are used effectively to show how ideas are interlinked.
Examples include “in contrast,” “this difference” and “in terms of actual numbers.” - Vocabulary and grammar are both excellent. No errors here, and some nice variety of sentence structure and word choice too. This makes the essay both easy and interesting to read.
More Practice IELTS Academic Writing Task 1 Sample Questions and Model Essays
- IELTS Academic Writing Task 1: Process Diagram with Model Answer
- IELTS Academic Writing Task 1: Map With Model Answer
- IELTS Academic Writing Task 1: Line Graph with Model Answer
- IELTS Academic Writing Task 1: Pie Chart with Model Answer
- IELTS Academic Writing Task 1: Comparing two Graphics with Model Answer
From there, you can study the “big picture” with Magoosh’s comprehensive guide to the entire IELTS Writing section.


