A distribution is a graph that shows what values of variable are more or less common in a population. Where the graph is higher, there are more people, and where the graph has a height close to zero, there are fewer people.
By far, the most famous and most useful distribution is the Normal Distribution, a.k.a the “bell curve.” It shows up everywhere, with an almost eerie universality. Suppose you were to measure one genetically determined bodily measurement (e.g. thumb length, distance between pupils, etc.) for every single human being on the planet, and then graphed the distribution: it would be a normal distribution. Same, for any genetically determined bodily measurement you could make on an animal or a plant, and measured it for every member of that species, it would be a normal distribution. The normal distribution is the shape of the distribution of any naturally occurring variable of any natural population. (Something like blood pressure might not be as normally distributed, because there are cultural and social factors that impinge on blood pressure – it’s not purely natural, unadulterated by culture.)
Properties of the Normal Distribution
All normal distributions on earth, from giraffe height to ant height, share certain fundamental properties in common.
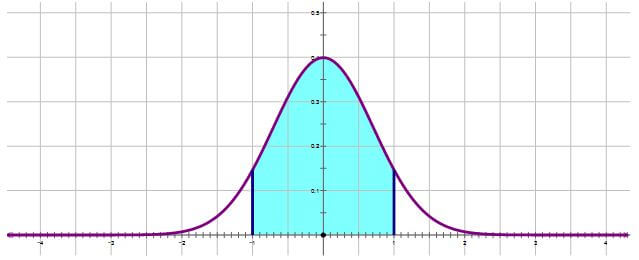
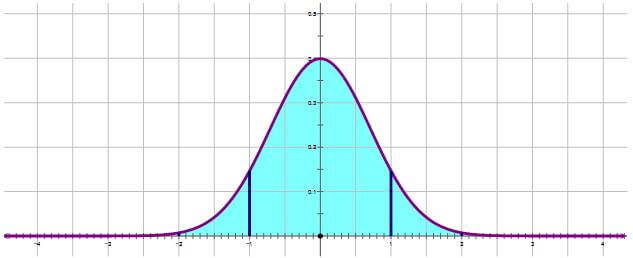
It’s important to appreciate that any Normal Distribution comes with its own “yardstick”, and that yardstick is the standard deviation. You can read more about standard deviation here. The very center of the Normal Distribution is the mean and median and mode all in one. We use the standard deviation to measure distances from the mean. If we go out a length of one standard deviation from the mean on either side,
that always includes 68% of the population, a little over two-thirds. This means that on either side, there is 34% of the population, very close to one-third: there’s 34% between the mean and one standard deviation below the mean, and there’s another 34% between the mean and one standard deviation above the mean.
If we go two standard deviations from the mean in either direction,
that always includes 95% of the population. You are somewhat uncommon if you are more than two standard deviations from the mean.
If we go out to three standard deviations from the mean in either direction, that includes 99.7% of the population, with only 0.15% (i.e. 15 people out of 10000) falling in each tail beyond this. The folks who are more than three standard deviation above the mean: they are the true outliers — the major league baseball hitters, the world famous violinists, the brilliant scientists and researchers — they truly stand out from the population at large.
If you simply remember these two numbers:
- 68% within one standard deviation of the mean (which means, 34% on each side)
- 95% within two standard deviations of the mean
then will have the ability figure out any GRE Math question that address the Normal Distribution.


Leave a Reply