
A GMAT score chart helps you visualize how your total score changes depending on your performance in each individual section of the exam.
For the legacy version of the GMAT (2023 and earlier), your overall score was determined solely by your Quantitative and Verbal scores. These two sections were plotted on the x-axis and y-axis of a chart, making it easy to see how one impacted your total score relative to the other.
However, the present-day GMAT adds a third scored section: Data Insights. Now, your total score is a combination of all three sections, with each contributing equally to your composite score.
With 3 variables, we can no longer use a simple 2D chart to list out all the possible scoring combinations. Instead, we combine a 2D chart with a 3rd input—an adjustable slider—to reveal not only the resulting total scores but also how slight adjustments to each section impact that total.
Interactive GMAT Score Chart
How to Use the GMAT Score Chart
- Choose Your Third Section: Decide which section you want to be controlled by the slider vs. appearing on the x- axis and y-axis of the chart. By default, Data Insights is set as the third section, while Quant is on the x-axis and Verbal on the y-axis.
- Adjust the Section Scores:
- Use the slider to set your score from 60 to 90 in Data Insights.
- Click on a score from 60 to 90 in the header row to set your Quant score.
- Click on a score from 60 to 90 in the first column to set your Verbal score.
- View Your Total Score: Your composite GMAT score (ranging from 205 to 805) appears on the chart where your selected Quant and Verbal scores intersect—factoring in your slider for the third section.
- For example, using the default settings, the two highlights intersect on the composite score of 545.
- By the way, 545 is the average total GMAT score. And the average scores of each GMAT section are:
- Data Insights: 74
- Quant: 78
- Verbal: 79
What Can We Learn from the GMAT Score Chart?
Aside from the most important result—the composite score that business schools use to evaluate applicants—playing around with the score chart reveals some interesting things.
Total Score Changes Aren’t Always Consistent
With the default settings in place, increasing your Quant score from 78 to 79 doesn’t budge your total score at all. It remains at a 545.
And increasing your Quant score by 4 points—from 78 to 82—only nets you a 20-point increase in your total score, from 545 to 565.
However, if you then score 3 points below the average on Data Insights, your total score will give up those 20 points and drop back down to a 545 total.
In other words, a 4-point gain (or loss) on one section may result in an unexpectedly larger (or smaller) impact on your composite score, depending on the scores in your other sections.
Score Improvement Opportunities
The score chart helps you understand your score trajectory and where you’ll get the most return for your effort.
For example, let’s say you know you’re naturally strong in Data Insights—you enjoy interpreting charts, combining information, and making data-driven decisions. Since the average score on that section is much lower than the other two sections, this could be your opportunity to outshine your competition.
If you believe you can score 6 points higher (an 80) on that section than average, your total score is already at a 585. To now achieve a 615—which is a good score—you only need to pick up a couple more points in the other sections: 3 on Quant and 2 on Verbal.
And needing to improve 2 points on Verbal is a very different situation—and study plan—than needing to increase by 5 or more.
💡Not sure what your strengths and weaknesses are? Take a practice GMAT test and find out! Not only will you get a baseline score to plug into the score chart above, you’ll also learn which sections present the best opportunity for improvement.
Interactive Legacy GMAT Score Chart
If you took the GMAT before 2024, that version is known as the Legacy GMAT (or Classic GMAT or sometimes the “10th Edition GMAT”). While that version of the test is no longer administered, business schools will continue to accept its scores for a few more years, so it’s still relevant for admissions decisions and benchmarking.
The legacy GMAT used a different composite scale, ranging from 200 to 800 instead of the present-day scale from 205 to 805.
Additionally, that version of the GMAT had its own scoring system since it was calculated using only two sections: Quant and Verbal. Though this test did have a third section called Integrated Reasoning, that section was graded on its own separate scale that didn’t factor into the composite score.
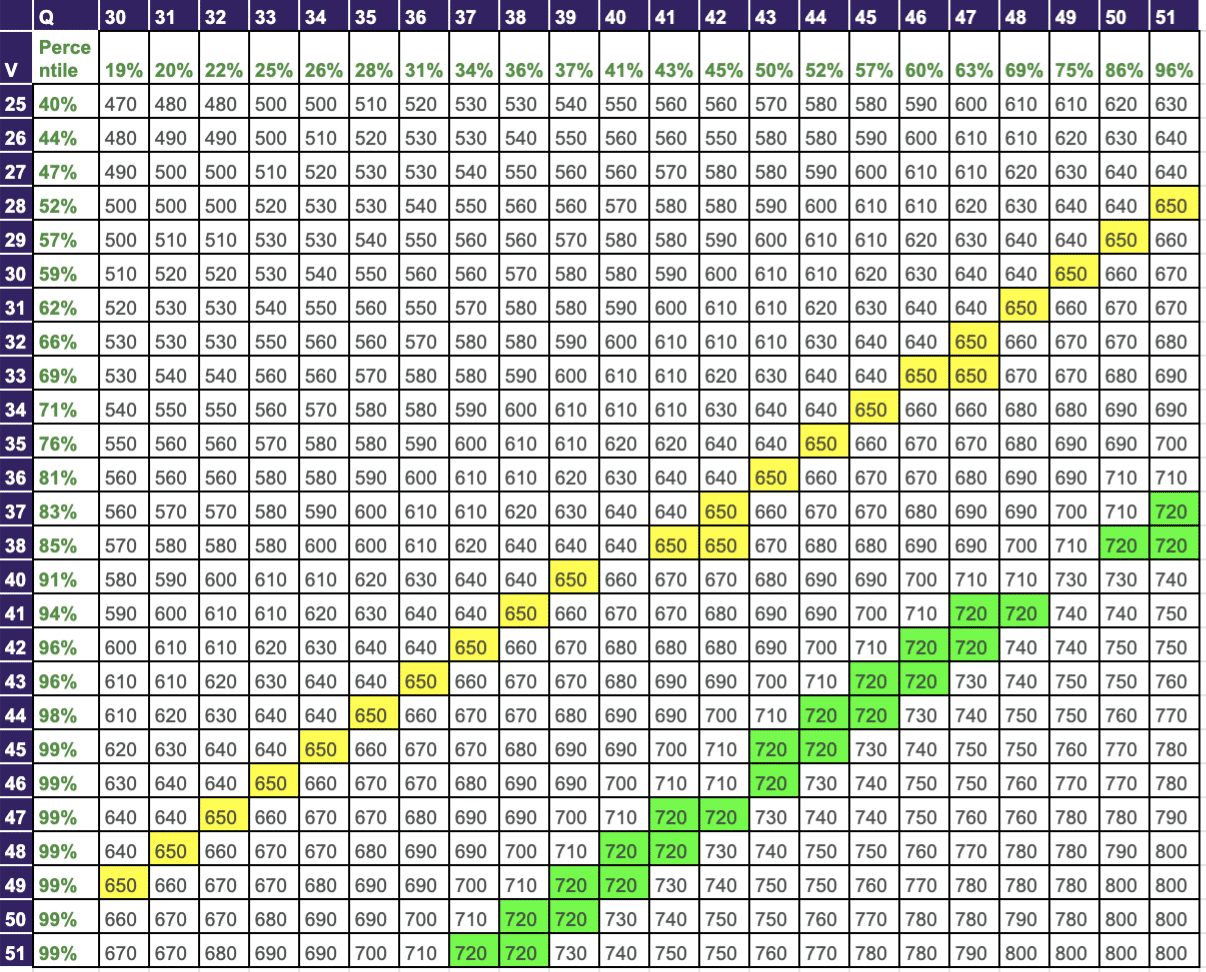
And because there were only two sections, that means using the legacy GMAT score chart below is straightforward:
- Select Your Quant Score from the horizontal axis.
- Select Your Verbal Score from the vertical axis.
- The cell where the two intersect shows your total GMAT score out of 800.
Downloadable GMAT Score Chart
Or if you’d like to see all the cells at once, click the image below to open up a full-sized score chart for the old version of the GMAT:
Legacy GMAT to Current GMAT Score Conversion Chart
What do those older, legacy GMAT scores mean in present day? Is a 650 on the old test better than a 645 on the new? No, that’s not the case.
You can’t directly compare the two scores by numerical value alone because the two tests evaluate different things (the current GMAT includes an entirely new section after all!). Thus, to see how an old scores ranks against a present-day score, you need to use a score conversion chart.
Fortunately, GMAC provides this data so that you—and the admissions department at any business school—know how to evaluate your past test in relation to the new scale. You can see how older scores directly relate to newer scores, along with the percentile ranking assigned to both.
| GMAT Score | Percentile Ranking | GMAT Focus Score |
|---|---|---|
| 800 | 100% | 805 |
| 790 | 100% | 785 – 805 |
| 780 | 100% | 755 – 785 |
| 770 | 100% | 735 – 755 |
| 760 | 99 – 100% | 715 – 735 |
| 750 | 98 – 99% | 695 – 715 |
| 740 | 96 – 98% | 685 – 695 |
| 730 | 95 – 96% | 675 – 685 |
| 720 | 93 – 95% | 665 – 675 |
| 710 | 91 – 93% | 655 – 665 |
| 700 | 88 – 91% | 645 – 655 |
| 690 | 83 – 88% | 635 – 645 |
| 680 | 78 – 83% | 615 – 635 |
| 670 | 78% | 615 |
| 660 | 78% | 615 |
| 650 | 69 – 78% | 595 – 615 |
| 640 | 62 – 69% | 585 – 595 |
| 630 | 62% | 585 |
| 620 | 59 – 62% | 575 – 585 |
| 610 | 52 – 59% | 565 – 575 |
| 600 | 49 – 52% | 555 – 565 |
| 590 | 49% | 555 |
| 580 | 43 – 49% | 545 – 555 |
| 570 | 40 – 43% | 535 – 545 |
| 560 | 35 – 40% | 525 – 535 |
| 550 | 32 – 35% | 515 – 525 |
| 540 | 32% | 515 |
| 530 | 25 – 32% | 495 – 515 |
| 520 | 25% | 495 |
| 510 | 25% | 495 |
| 500 | 22 – 25% | 485 – 495 |
| 490 | 20 – 22% | 475 – 485 |
| 480 | 20% | 475 |
| 470 | 17 – 20% | 465 – 475 |
| 460 | 15 – 17% | 455 – 465 |
| 450 | 12 – 15% | 445 – 455 |
| 440 | 11 – 12% | 435 – 445 |
| 430 | 11% | 435 |
| 420 | 11% | 435 |
| 410 | 9 – 11% | 425 – 435 |
| 400 | 8 – 9% | 415 – 425 |
| 390 | 8% | 415 |
| 380 | 7 – 8% | 405 – 415 |
| 370 | 6 – 7% | 395 – 405 |
| 360 | 6% | 395 |
| 350 | 4 – 6% | 375 – 395 |
| 340 | 4% | 375 |
| 330 | 4% | 375 |
| 320 | 3 – 4% | 365 – 375 |
| 310 | 3% | 355 – 365 |
| 300 | 2 – 3% | 345 – 355 |
| 290 | 2% | 345 |
| 280 | 2% | 335 – 345 |
| 270 | 2% | 335 |
| 260 | 2% | 335 |
| 250 | 1 – 2% | 315 – 335 |
| 240 | 1% | 305 – 315 |
| 230 | 1% | 295 – 305 |
| 220 | 1% | 285 – 295 |
| 210 | 0 – 1% | 255 – 285 |
| 200 | 0% | 205 – 255 |
Closing Thoughts
Your overall GMAT score—whether determined by a score chart or another tool such as a score calculator—is just one piece of your GMAT journey. It’s essential to put that score into context, namely in terms of what scores schools are looking for and how your score percentile stacks up to other test takers.
And of course there’s the other side of GMAT scores: prepping to achieve them! And for that, Magoosh is here to help. Check out a Magoosh GMAT Premium plan for the lessons, practice questions, and practice tests that will lead you to success.
FAQs about the GMAT Score Chart
Can a high score in one section compensate for a lower score in another?
To some extent, yes. Because all three sections (Quant, Verbal, and Data Insights) are equally weighted in the total. score, a strong performance in one section can help offset a weaker one.
However, don’t rely solely on this. A lopsided score profile may raise red flags, especially at competitive programs that expect balanced skill sets.
Use the score chart to test these scenarios and see how your total score shifts with different combinations.
What kind of total score improvement can I expect from improving 5 points in a section?
That depends on the other two section scores. Score changes aren’t always consistent. But you can probably expect your total score to change by 30 or, in some cases, 40 points.
What’s the best section to focus on first for improvement?
Start with the section that offers the highest return on effort. Look at your practice test data to see which sections have the most room for improvement. Next, use the score chart to see how much a few points in each section would raise your total score. Then, consider which section you can reasonably achieve the best gains in based on your strengths and weaknesses and how much time you have available to study.