
Praxis Core Math questions involve statistics and probability in a variety of ways. This guide will serve as a comprehensive review of core math concepts related to statistics and probability that you will need for the Praxis Core Math exam. We will be discussing:
Praxis Core Math: Statistical Relationships
Praxis Core Math deals with statistical linear relationships between two variables. On the exam, these two-variable relationships are charted visually. Core Math statistical relationship graphs have an appearance somewhat similar to the linear equation graphs that appear elsewhere on the exam. But there are also some distinct differences.
Scatter plots
Sometimes the variables in a linear statistical relationship are unnamed, and are simply called variable x and variable y. When Praxis Core Math depicts relationships with unnamed variables, the exam usually uses scatter plots. Core Math scatter plots depict three kinds of relationships: positive, negative and neutral.
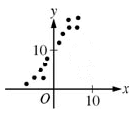
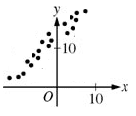
A positive relationship happens when two variables both increase– x goes up, and y goes up. Here’s a visual example:
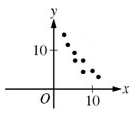
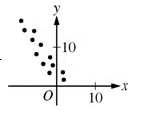
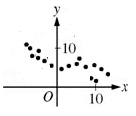
A negative relationship happens when only one of the variables goes up, while the other goes down. This can be seen here:
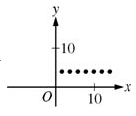
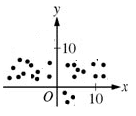
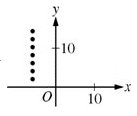
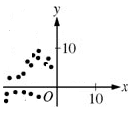
And in a neutral relationship, either one variable doesn’t change while the other does (see the image on the left below), or both variables change in unpredictable ways, with no clear relationship between x and y (image on the right side below).
In the graphic below, the scatter plot depicts two kinds of relationships. On the left side of the y axis, where the values for x are less than zero, x and y have a positive relationship. In a positive relationship, when one variable’s numeric value increases, the other variable also goes up. This type of positive relationship is evident on the left side of the scatter plot, because the coordinates get closer to zero along the x axis and closer to 10 on the y axis.
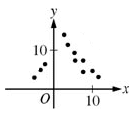
Once you go above 0 on the x axis, however, x and y have a negative relationship. A relationship between two variables on a scatter plot is negative if one variable goes down while the other goes up. On the right you see that the coordinates keep moving up on the x axis, getting closer and closer to 10 as they progress in the righthand direction. However, once x gets above 0, the y value of each coordinate moves downward. As x gets closer to 10 on each coordinate, the coordinates’ values for y drop down closer and closer to zero.
Line graphs
In some Praxis Core Math questions, the variables in a Core Math statistical relationship are clearly identified, instead of simply being labeled with letters. When there are two meaningful variables in Core Math, their relationship is usually depicted as a line rather than a scatter plot of coordinates.
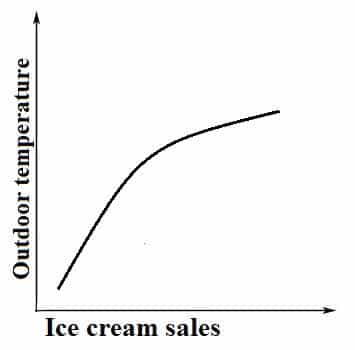
A pair of variables in a Core Math line graph could be– say– ice cream sales and outdoor temperatures. The most obvious relationship between these two variables– one would assume– is that as it gets hotter outside, ice cream sales go up, because people like to eat ice cream when it’s hot.
This simple presumed relationship between ice cream sales and outdoor temperature would look like this on the Praxis Core Math exam:
The takeaway
Notice above that the line for the combined rise of temperature and ice cream sales is not perfectly straight. Lines in this kind of Core Math statistical chart are not meant to be straight, predictable, and formula-based, the way they would be in Core Math linear equation charts. Similarly, the points on scatter plots do not necessarily form a straight line.
The big idea in Core Math statistical relationship graphs is to visualize the general connection between two variables, not a precise numerical equation than makes a straight line on a graph.
Unidentified variables in Praxis Core Math will simply be labeled as x and y. On the Core Math test, non-specific variables are usually depicted as a scatter plot rather than a line.
Now, let’s look at sample questions involving line graphs and scatter plots that depict statistical relationships.
Scatter Plot – Practice Question
Which of the following most suggests a positive linear relationship between x and y?
- A)
- B)
- C)
- D)
- E)
Line Graph – Practice Question
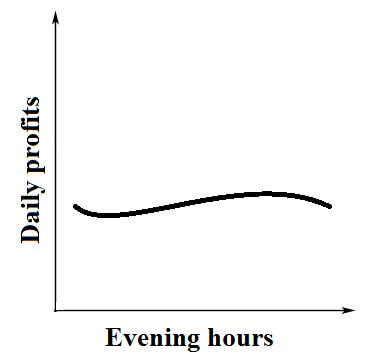
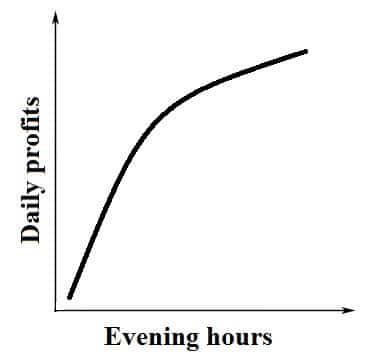
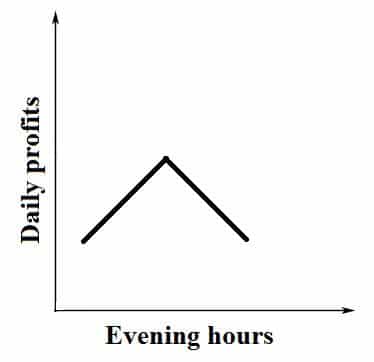
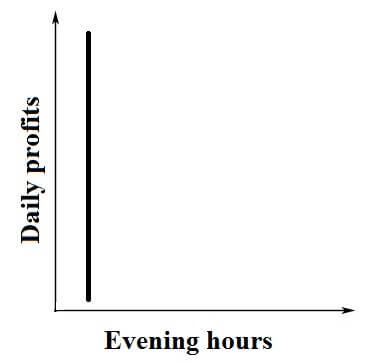
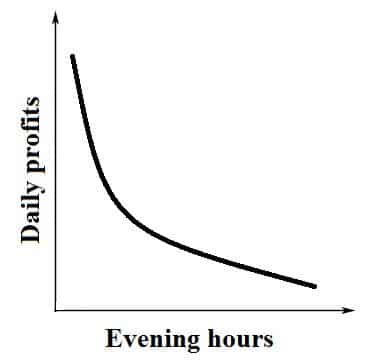
A store owner observed that the longer she kept her store open in the evening, the lower her daily profits were. Which of the following graphs could be the graph of the relationship the store owner observed when reviewing evening store hours and profits?
- A)
- B)
- C)
- D)
- E)
Check out the correct answers and their explanations here!
Praxis Math: Ratios of Probability
What is a Ratio of Probability?
A ratio of probability is a fraction expression of an event’s odds— the chances that an event will happen. To give a very simple example, if you flip a coin one time, there is one out of two chance that the coin will land on heads, and a 1 out of 2 chance the coin will land on tails. So the ratio of probability for heads is 1/2, and the ratio of probability for tails is 1/2.

What Are the Variables for Calculating a Ratio of Probability?
All ratio-of-probability questions involve two variables that can be assigned numeric value.
One of these variables is the total number of possible events. In the example I gave above, with the coin toss, the total number of possible events is two. This is because, in a single coin toss, exactly two different outcomes are possible. You can have one event where a coin lands on heads, and you can have another event where a coin lands on tails; this adds up to two possible events total.
The other variable in a Praxis Core math ratio-of-probability question is the “focus event”– a specific type of event within the larger number of total possible events. The focus event is the event for which odds are calculated. In other words, the probability of the event is being focused on in the problem.
The “all possible events” variable will always have an equal or higher numeric value than the “focus event” variable. The set of “focus events” has to be the same size or smaller than the set of all possible events, because it’s taken from that larger set.
The formula for calculating the probability ratio for a focus event is the “focus event” divided by “all possible events” or commonly written as FE/AE.
Ratio of Probability: Formula Example
To give you an idea of how this formula can be used in Praxis Core Math, let’s look at a sample problem. This problem will be simpler than the ones you’ll find on the Core Math exam itself. But the principles are the same— the problem represents the way you’ll calculate a ratio of odds on the real Praxis Core Math test.
- Sample Problem:
There are four sealed brown paper bags on a table. Two bags each have one apple inside of them. Another bag contains a plum, and a fourth bag contains a peach. If one bag is chosen at random, what is the probability that the selected bag will contain an apple?
- Calculating the odds:
The “focus event” is the event where a bag with an apple is selected from the table. Because there are two bags with apples in them, the total number of possible instances of the focus event is 2. So, FE= 2. The number of all events total is 4, because events involve selecting one bag, and there are four bags total. So AE=4. Now remember, the formula for calculating any ratio of probability on the Praxis Core is FE/AE. In this problem, FE = 2 and AE = 4. So you can calculate the ratio of probability for selecting a bag with an apple using 2/4. 2/4 simplifies into 1/2. So the odds of selecting an apple from the four bagged fruits on the table above is 1/2.
This example problem follows the same pattern as most of the ratio-of-probability questions you’ll see on the Praxis Core Math test. But there are some other ratio-of-probability questions where you’re given the ratio and will have to calculate a different value from the original data, such as the value for FE, AE, or some other component of the data set.
Ratio of Probability: Calculate Data
Here is a sample problem with this kind of Praxis Core Math “reverse calculation” that starts with the ratio of odds and works back to the original data:
- Sample Problem:
A box contains a number of colored pens, of which 12 are red, and the rest are blue. If a person were to take a pen at random from the box, the probability that the pen taken would be red is 1/3. How many blue pens are there in the box?

- Calculating the answer, based on the given data:
OK, let’s think about this. The focus event is the selection of a red pen from the box. There is a 1 in 3 chance of that focus event happening. That means that 1/3 of the total number of pens in the box must be red pens. Since there are 12 red pens, 12 must be 1/3 of the total number of pens in the box. From here, we can easily calculate the total number of pens.To do this, we compare the focus event (FE) value in the ratio to the number of actual focus events. As you’ll recall, the FE number is the top number in the ratio– 1 in the case of the ratio given above. You can multiply 1 by 12 to get the actual number of focus events, which is 12.So you must also be able to multiply the bottom all-events (AE) value by 12 to get the actual number of all total events from the original data set. 3 times 12 is 36. So originally, the total amount of events– an event being the taking of any single pen from the box at random– is 36. In short, your calculation to get the total number of pens in the box looks like this: FE/AE = 1/3 = 12/x = 12/36.But we’re not done yet– the question isn’t asking for the total number of all pens. It’s asking for the number of blue pens. This can be calculated easily with one additional step. Because all the pens in the box are either red or blue, you can subtract the number of red pens from the total number of pens to get the amount of blue pens. In other words, AE – FE = the total number of blue pens. 36 – 12 = 24. So there are 24 blue pens.
Now, here are two practice ratio-of-probability problems that are truly Praxis-like. Let’s see how you do!
Calculating the Ratio: Practice Question
Of the 45 assorted candies in a bag, 15 are red, 10 are blue, 10 are yellow, and the rest are green. One candy is to be randomly selected from the bag. What is the probability that the candy selected will not be red?
A) 1/3
B) 2/45
C) 35/45
D) 2/3
E) 8/15
Using the Ratio of Probability to Calculate Data
A group of adults includes 24 adults who are between 5 and 6 feet tall, and 9 adults who are less than five feet tall. The remaining adults are more than 6 feet tall. The probability that a randomly selected adult in the group will be under 5 feet in height is 1/5. How many adults in the group are more than 6 feet tall?
A) 12
B) 24
C) 33
D) 40
E) 54
Click here for answers to these Ratio of Probability questions!
Praxis Core Math: Statistical Vocabulary
Of all the Praxis Core Math question categories, statistics and probability is the most multifaceted.Praxis Core Math has questions about two kinds of content knowledge regarding statistics and probability. One question type deals with statistics vocabulary. Stats vocabulary questions require a good understanding of three key statistics terms: mean, median, and range. The other question type focuses on statistical methods. Statistical methods questions on the Praxis Core don’t require any math calculations at all. You simply need to be able to identify valid statistical methods for gathering statistical information.
Vocabulary for Praxis Statistics and Probability: Mean, Median, Range
The mean of a set of numbers, sometimes also called the average, is the number you get when you divide the sum of a number set by the total amount of numbers in the set. Let me give you a simple example. Suppose you have one banana that is 25 centimeters long, one banana that’s 15 centimeters long, and one banana that’s 23 centimeters long. The sum of these three numbers is 63 (because 25 + 15 + 23 = 63). The total amount numbers you’re working with is 3–one numerical measurement for each banana. 63 divided by 3 is 21. So the mean or average length of the bananas in this small group is 21 centimeters.
The median is the middle number in a set of numbers that has been arranged in sequence from smallest to largest, or from largest to smallest. The median number will be the same either way. Let’s look at the median from the three number data set for banana length from the previous paragraph.
- Numbers, from smallest to largest, with median underlined: 15, 23, 25
- Numbers from largest to smallest, with median underlined: 25, 23, 15
As you can see, 23 is in the exact middle of the number set, provided the number set is sequenced by size. Of course, there can’t be an exact middle number if there is an even amount of numbers. What do you do then? Well, the Praxis exam won’t actually make you deal with the medians of even number sets. But in case you’re curious, to get the median in that situation, calculate the average of the two numbers in the middle. For example, in the number set [1, 4, 6, 12], the median would be 5, the average of 4 and 6.
But like I said, you won’t need to worry about mean-based medians on the Praxis Core. What you will need to worry about are number sets that are longer than just three numbers, number sets that are not listed in numerical order, and questions about how a median will change if a number set is changed.
The statistical range of a number set is calculated by subtracting the highest number from the lowest number. Here are two examples of range calculation:
- Number set: 1, 2, 6, 7, 9, 13
Range = 13 -1 = 12 - Number set: 100, 4, 2/3, -5, 82
Range: 100 – (-5) = 105
The second number set, as you probably noticed, is a little more complex than the first. There are positive numbers, negative number, whole numbers, and fractions. Moreover, the numbers are not in proper numerical order. This second set is more Praxis-like. The Praxis Core will give you questions for both median and range that require you to carefully read and mentally re-organize sets of numbers.
Praxis Math Core: Statistical Methods
These questions are probably the easiest questions on Praxis Core math. You don’t need strong vocabulary knowledge and you won’t need to create or solve an equation. You just need some common sense. You’ll need to know what is and isn’t statistics. Data regarding just one item or thing is not statistical, while information about a group of things is an example of statistics.
And you’ll need to recognize what is being examined in a statistical study, and the best way to examine it. For instance, a statistical analysis of all the workers in a company shouldn’t just focus on male workers, statistical samples should be collected randomly, etc. These kinds of statistical methods concerns will come up on the Core Math exam.
Statistical Vocabulary Practice Question: Median and Range
The median age of a group of 19 people is 35 years, and the range of age in the group is 7 years. If 5 were added to each of the 19 ages, which of the following statements regarding the median and range of the modified 19 ages would be true?
A) The median age will increase, but the range will stay the same.
B) The median age and age range will both stay the same.
C) The median age will stay the same, but the age range will increase.
D) The median age will stay the same, but the age range will decrease.
E) The median age and age range will both increase.
Praxis Statistical Vocabulary: Mean
The weights, in pounds, of 7 barbells in a gym are 4, 50, 20, 25, 15, 35, and x. If the average (arithmetic mean) weight of the 7 barbells is 22 pounds, what is the value of x?x = ____
Statistical Methods: Sample Problem
A supermarket manager wants to ask a sample of customers whether they’d be interested in buying more international food. Which of the following methods of selecting a sample will yield the most valid information about the feelings of the supermarket’s customers?
A) Interviewing customers who visit the international food aisle in the grocery store.
B) Selecting a random sample of customers ages 18-35
C) Selecting a random sample of customers each day of the week, throughout store hours
D) Asking customers for their email addresses, emailing the customers a survey, and using the completed surveys as the sample
E) Choosing customers at random at a specific time on a given day of the week
Check out the answers and their explanations here!
Praxis Core Math: Answer Key & Explanations
Statistical Relationships
- C
- E
Problem 1:
A positive linear equation will show the coordinate plots increasing in value for both x and y. As the plots increase in value, they will go both upward (increasing y value) and move to the right (increasing x value). So a positive relationship will move diagonally upward, from left to right. Answer C has the only scatter plot that looks like this.
Problem 2:
For the correct graph, daily profits need to start high on the left side of the graph, close to the top of the up-pointing “Daily profits” arrow on the chart. Then the profits need to go down as the store is open longer in the evening, as indicated by the right-pointing “Evening hours” arrow on the chart. So the correct answer will show daily profits starting high on the left and then becoming lower as the line moves to the right. Answer E shows this linear pattern; the other answers do not.
Ratio of Probability
- D
- A
Problem 1:
In the first problem, all information about blue and yellow candy is irrelevant, and is simply there to distract you as you look for the correct answer. Remember the math tips I gave you for avoiding distractions? Very important here– both for getting the right answer and for properly pacing yourself, and not wasting precious time!
There are only two numbers you need to pay attention to here. One key number is 45, the total number of candies. The other key number is 15. 15 is the number of candies that are red. But you want the number of candies that aren’t red. Drawing out a non-red candy is your focus event. Since the focus event involves by all candies other than the 15 red ones, and the total number of candies is 45, you can get the non-red candy focus event value by subtracting the red candy count from 45. 45 – 15 = 30. So the number of possible instances of selecting a non-red candy is 30.
So… FE/AE = 30/45 = 2/3.
But there’s a shortcut to solving this problem. You could look at the numbers given and notice that the ratio-of-probability for drawing a red candy is 1/3. You could then realize that if drawing a red candy takes up 1/3 of all possibilities, then drawing anything that isn’t red would take up the remaining 2/3 of the probability.
Problem 2:
This one is a little tricky. You need to figure pout how many adults in the group are more than 6 feet tall… but you haven’t even been given the number for the total amount of adults in the group. Well, actually, you have been given this number indirectly. Let me explain….
You’ve been told that there are 9 adults in the group who are less than 4 feet tall. And you’ve been told that the odds of randomly selecting one under-5-foot adult from the group are 1 in 5. So you know that the ratio-of-probability for selecting a short adult is 1/5. The 1 in that ratio represents the odds of selecting 9 different possible short adults. So 1 can be multiplied by 9 to get the focus event value for short adults from the original data.
And if you multiply 1 by 9 to get the original focus event value, you must be able to multiply 5 by 9 to get the value for all events— the total number of adults in the group. 5*9 = 45, so there must be 45 adults in total.
Now you have all the numbers you need in order to calculate the amount of really tall adults– the ones over 6 feet tall. There are 45 adults in total, there are 24 adults between five and six feet tall, and there are 9 adults who are less than five feet tall. Subtract 24 and 9 from 45, and whatever is left over will be the remaining adults who are taller than 6 feet. 45 – 24 – 9 = 12, so the answer is A.
Statistical Vocabulary
- A
- 5
- C
Problem 1:
The median is one of the numbers in the group of 19 numbers; it will be the 10th number in the list when the numbers are arranged in numerical sequence. So if every number increases by 5, that will include an increase in 5 to the median number. The range is the largest number in the set minus the smaller number. If 5 is added to both the largest and smallest number, the difference between the numbers will remain the same, i.e. 19-1 = (19+5) – (1 + 5) = 18.
Problem 2:
To find the mean–or average–of a group of numbers, you add the numbers together and divide by the amount of numbers that were added together. The formula looks like this: (sum total)/(number of items) = mean. The average weight of these 7 barbells is 22 pounds, and the weight of one barbell is not known and is called x. Plug in the numbers to the formula, and you get: (4 + 50 + 20 + 25 + 15 + 35 + x) /7 = 22. This can be simplified to (149 + x)/7 = 22. You can simplify this again by multiplying both sides by 7. Then you get: 149 + x = 154. So x = 154 – 149, which equals 5.
Problem 3:
The best way to measure the views of all of the customers together is to collect information from as many customers as possible. It’s also important to select the customers at random, because a specific group of customers may have opinions that are different from the rest of the customers. Answers C and D both reach out to a very large number of customers. However, with answer D, the supermarket manager would only get information from customers who were willing to give out their emails and complete the survey. With choice C, we get the most random selection of customers, and probably the greatest number of customers.


Leave a Reply