
So you may have memorized all of the derivative rules. You might be able to derive f '(x) from f(x) no matter how complicated the function is. But how are you at estimating derivatives directly from the graph?
As we’ll see in this review article, it’s all about slope!
The Derivative Measures Slope
Let’s begin with the fundamental connection between derivatives and graphs of functions.
The derivative value f '(a) equals the slope of the tangent line to the graph of y = f(x) at x = a.
I recommend brushing up on the idea of tangent lines first. Here are a few resources that might help.
- How to Find the Slope of a Line Tangent to a Curve
- Is the Derivative of a Function the Tangent Line?
Example — Estimating Derivatives using Tangent Lines
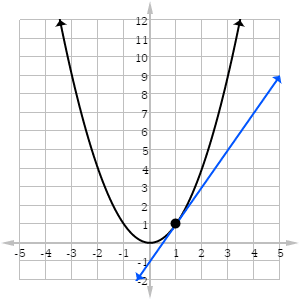
Use the information in the graph of f(x) below to estimate the value of f '(1).
Solution
Remember, derivative values are slopes! So f '(1) is equal to the slope of the tangent line attached to the graph at x = 1.
All it takes is two points on a line to determine slope. One point is easy to spot because it’s also on the graph of f itself: (1, 1). Next we look along the tangent line until we find another point whose coordinates are easy to estimate. Try to find a point that crosses an “intersection,” because then it will have integer coordinates. For example, (2, 3), or (3, 5), or (0, -1), etc.
I’m going to pick (3, 5) as my second point. However, if you pick any other point, as long as it’s on the tangent line, then your answer should be equal (or very close) to mine.
Next, use the slope formula (RISE over RUN) to compute the slope of the tangent line.
![]()
Therefore f '(1) = 2.
Increasing, Decreasing, and Turning Around
Ok, so the first example may have been pretty easy. How hard can it get?
Sometimes we have to estimate all of the derivative values! In other words, given the graph of a function f(x), it should be possible to sketch a graph of f '(x).
There are three things to keep in mind for differentiable functions.
- If f is increasing on an interval, then f ' > 0 (above the x-axis) in that interval.
- If f is decreasing on an interval, then f ' < 0 (below the x-axis) in that interval.
- If f turns around smoothly at a point x = a, then f '(a) = 0 (intersecting the x-axis).
Example — Estimating the Graph of a Derivative
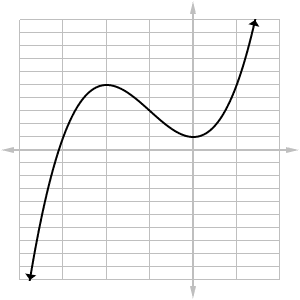
Sketch the graph of the derivative of the function whose graph is shown below.
Solution
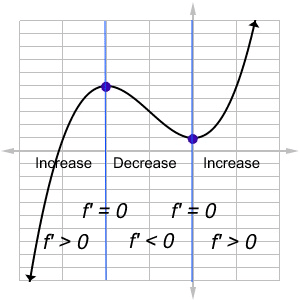
First identify the two turnaround points: at x = -2 and 0. This means that f '(-2) = f '(0) = 0.
Then, identify the intervals on which the graph increases and decreases. When f is increasing, we have f ' > 0. When f is decreasing, we have f ' < 0.
The graph below shows the original in black and a sketch of its derivative in blue.
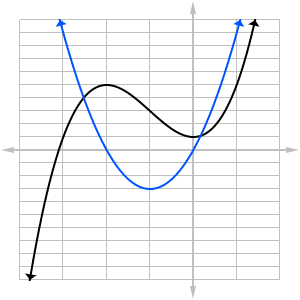
Notice how the blue curve fits the description of f '.
- The blue curve is above the x-axis whenever f increases.
- The blue curve is below the x-axis whenever f decreases.
- The blue curve crosses the x-axis whenever f has a turnaround point.
Non-Differentiable Points
The methods for estimating derivatives so far have ignored an essential issue. What happens when the function fails to have a derivative value at a given point?
Any point x = a at which f '(a) does not exist is called a point of non-differentiability.
If a is such a point, then there will either be a hole or break in the graph of f ' at x = a.
Three things could cause such behavior.
- The original function is undefined or discontinuous.
- There is a corner point in the original function’s graph.
- The tangent line is vertical.
Let’s explore the three situations in the following example.
Example — Estimating Derivatives With Non-Differentiable Points
Sketch the graph of the derivative of the following function.
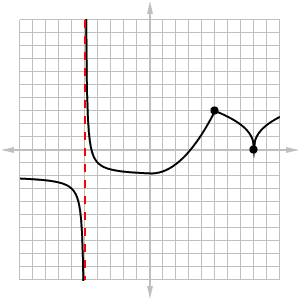
Solution
There is a lot going on in this graph!
- There’s a vertical asymptote at x = -5. Because f is undefined at this point, we know that the derivative value f '(-5) does not exist.
- The graph comes to a sharp corner at x = 5. Derivatives do not exist at corner points.
- There is a cusp at x = 8. The derivative value becomes infinite at a cusp.
Aside from these important landmarks, there’s also one turnaround point, at x = 0. Let’s analyze what happens in the intervals between the special points.
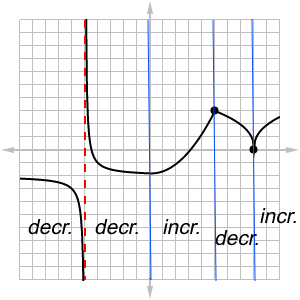
But what exactly happens near x = -5, 5, and 8?
At x = -5, the original graph follows a vertical asymptote. By definition, the function values are approaching ∞ or -∞ the closer x gets to -5. As a result, the function gets infinitely steep as x → -5. Infinite steepness means infinite slope values, so f ' must also have a vertical asymptote at x = -5.
Next, the corner point at x = 5 represents a very sudden change in direction. Rather than turning around smoothly, the function instantly changes course. That means that there will be a jump in the derivative value when crossing x = 5.
(For more about jump discontinuities and related topics, check out: AP Calculus Review: Discontinuities.)
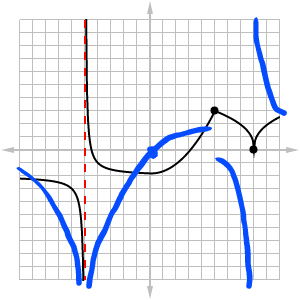
Finally, there is a cusp at x = 8. At a cusp, the graph’s tangent line becomes so steep that it’s effectively vertical. That means that the slope is infinite, and again there will be a vertical asymptote in the graph of f '.
Let’s put it all together now. The blue graph represents just a sketch of the derivative curve (not 100% accurate, but close enough for our purposes).
Notice not only the odd behavior near each point of discontinuity, but also how the derivative values are above the x-axis when f is increasing and below the axis when f is decreasing.
Conclusion
It’s important to know how to identify the derivative of a function based only on its graph. Fortunately, the AP Calculus exams will not require you to sketch the derivative curve itself, but may ask you to pick which answer choice best matches it.
Use smooth turnaround points as landmarks. Make sure you understand the strange behavior at non-differentiable points. And fill in the details by analyzing where f increases and decreases.


Leave a Reply