
For Data Interpretation and Research Summaries questions on the ACT Science Test, you will often be presented with a set of graphs and tables and required to answer relevant questions. Remember, it’s important to take the time and thoroughly analyze the data before jumping to the questions.
Some Tips to Remember:
Tip #1 – Read all of the labels.
What is in each column? What is in each row? What is the range of values? Does the data have a direct or indirect relationship? Do the lines have positive or negative slopes? Where was there the most change or growth? Where was there the least? With this kind of discipline, you will already understand what is being presented. The question becomes almost an afterthought, and you’ll know exactly where to look for the correct information.
Tip #2 – You won’t need all the information to solve.
Chances are the correct answer hinges on just one or two numbers from the data tables or graphs. Most ACT students get ACT Science questions involving data analysis wrong because they do not know what data to use to solve, not because the math involved is difficult. You will likely only be performing calculations as simple and easy as addition, subtraction, multiplication and division.

Tip #3 – Round decimals and fractions.
Let the answer choices be your guide. If they are very close together, then you will need to be more accurate in your approximation. However, if the answer choices are markedly far apart, then by all means round to the nearest integer.
Time to Practice
Let’s look at a practice ACT Science data table, just like the ones you’ll see on Test Day!
Two scientists are conducting experiments using a spectrum machine. The spectrum machine measures the transmittance and absorbance of solutions at various wavelengths of light. Scientists placed solutions of various chlorophyll concentrations into a spectrum machine and recorded the transmittance at 4 wavelengths in Figure 1.
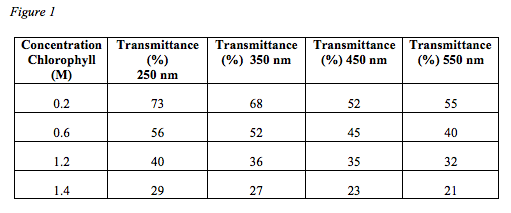
According to the results of the experiment, chlorophyll has the highest transmittance at a wavelength of:
(A) 250 nm
(B) 350 nm
(C) 450 nm
(D) 550 nm
Notice that the values listed in Figure 1 for a transmittance of 250nm–73, 56, 40, and 29–are the highest for each chlorophyll concentration. Therefore, figure 1 consistently shows the highest transmittance levels at a wavelength of 250 nm. The correct answer is (A).
The Takeaway
Think of this section as an open book test: all the information you need to answer the question is right there in front of you! The trick is to know how to find it without getting bogged down in unnecessary information.


Leave a Reply