
The New SAT really puts an emphasis on visuals in all of its sections. You’ll find charts and graphs in Reading, Writing and Language, and Math. With this new emphasis on visual literacy, the reading of graphs and charts, it’s good to prepare for the kinds of visuals you’ll see on the exam.
In this post, we’ll look at the graphics in the most visual part of the New SAT: the Math section.
Geometric Visuals in New SAT Math
The biggest change to SAT Math involves geometric figures, which are images of lines, angles, and shapes. With the New SAT’s increased emphasis on geometry, there are now so many more of these!
In the case of geometric forms, it’s important to understand that some geometric forms are drawn to scale, and some aren’t. If a form is drawn to scale, then the angles and proportions are visually accurate. In other words, an angle that’s labeled as (for example) 90 degrees on a geometric image will actually be 90 degrees if you physically measure it with a protractor. Similarly, if one drawn-to-scale line is labeled as being 10 centimeters long, and another line in the image appears to be half the length of the 10cm line, the shorter line can be accurately estimated at roughly 5cm.
So obviously, drawn-to-scale images can help test-takers estimate answers for measurements that aren’t given in the image or problem. How can you know if an image is drawn to scale? Easy! The exam will tell you if an image is not drawn to scale, with a disclaimer that says “Note: figure not drawn to scale.” Any geometric images that don’t have this note are drawn to scale. So if an estimation of an angle, line length or other measurement in the image is required, you can “eyeball” the image and approximate measurements based on known data.
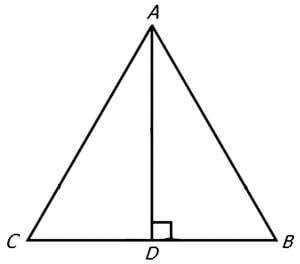
For instance, in this drawn-to-scale diagram, you can estimate that angle ADB is 90 degrees, and you can make further sight-based assessments that the degrees of BDA and CDA are smaller than 90. Furthermore, a close visual inspection shows that angles CAD and DAB are smaller than BDA and CDA. These visual estimates can help you eliminate multiple choice answers that are inconsistent with the image, and select a correct answer that matches what you see.
It’s equally important to not attempt this kind of estimation of the image isn’t to scale, of course. Here is a diagram where you can’t do that, and must rely on knowledge about the rules of geometry to answer the question:
(Note: Figure not drawn to scale)
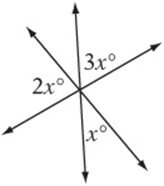
In this case, you can’t estimate the angle of X just by looking at it, because the scale is not accurate. However, you can understand that a straight line is a 180 degree angle and you can further understand that opposite angles in an intersection of lines are congruent, having the same degree measurement. From there, you can understand that the equation to solve for x is x + 2x+3x= 180, or 6x=180.
For all geometric imagery, it’s important to understand the mathematical principles, rules, and vocabulary that underscore what you’re looking at. Suppose you see this image (not drawn to scale) in a New SAT Math question:
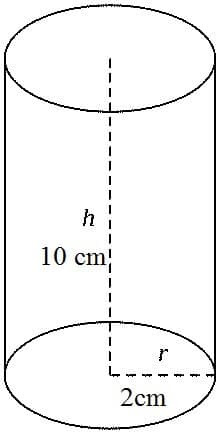
You should immediately be able to understand that r stands for radius and that h stands for height. You should know that the radius is the length from the edge of a circle to its center. You will further need to understand that radius and pi (the number indicated by this symbol: π) can be used together to calculate the area of a cylinder’s base, its circular bottom surface. Additionally, you should know that the formula for the area of a base is πr². In connection with this, you should also recognize that h and r in the image can be used together to calculate the volume of the cylinder. The formula for cylinder volume is pi times base squared times height, or πr²h. (Using the numbers given in this image, that would be π2²10, or π40. Since π= approximately 3.14, the volume of this cylinder is around 125 square centimeters.)
Be prepared to have a similar fluency in other geometric vocabulary, formulas, and concepts. Although the New SAT will give you the formula you need in some cases, you are likely to use geometric principles clumsily if you haven’t already learned and practiced these formulas before test day. Without good prior knowledge of geometry, there is a high risk that you’ll misread and miscalculate what you see in the geometric images on the test.
While geometric visuals are a very significant part of Math in the New SAT, graphs and tables that index information are also very important to this section of the exam. I’ll cover those next.
Other New SAT Math Infographics, Graphs and Charts
Now, I’m going to walk you through the graphs and charts found in non-geometry problems. I’ll show you how to read data infographics and how to use this graphic information to correctly answer New SAT Math questions.
In Math on the New SAT, graphs and tables index two types of information: concrete “story problem” information and abstract mathematical concepts. A visual with concrete information shows statistics for specific things, such as the number of people in a group of students, the relationship between two variables such as educational level and income, and so on.
Here is a typical “story problem” type graph that you might see on the New SAT:
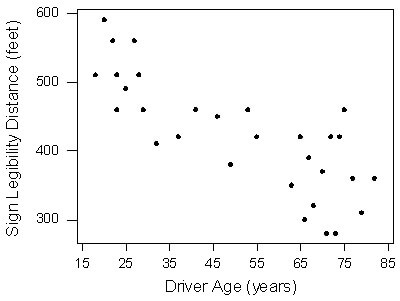
With a graph like this, you’ll be asked to make calculations, estimates or interpretations of the relationship between age and the ability to read road signs while driving. There can be other similar visuals where the only things you’re being questioned on is a mathematical concept. Take a New SAT question like this one:
- Which of the following graphs best shows a weak positive association between x and y?
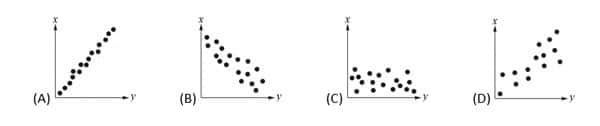
(Answer: D)
Here, the graphs only show mathematical concepts of association, and don’t actually deal with the way any specific variables are associated with each other.
This same split between “pure math” and “story problem math” can be seen in data tables. On the New SAT’s Math section, you’ll often see tables presented in this way in a question:
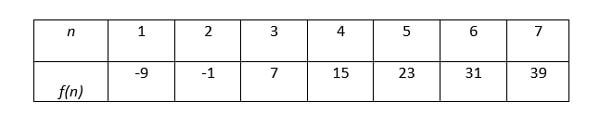
A) f(n)= n-10
B) f(n)=8n-17
C) f(n)=8n-10
D) f(n)=n+8
(Answer: B)
A story-problem-based table might look more like this:
Average height of different species of trees Plot A, a 3 square mile forested area:
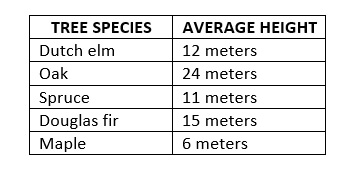
In a story problem based on the table above, you might crunch the numbers in various ways, making calculations that pertain to real-world variables such as average tree height, differences in heights between tree species, and so on.
Some test-takers find graphs and tables that deal in “pure math” to be easier than story-problem infographics, because there is less information to keep track of. Other test-takers (myself included) are a little bit more comfortable with graphs and tables that contain specific information, as this can make it easier to visual a math problem.
Regardless of your preferences, in the New SAT Math section you should be prepared to read a variety of visuals, some of which index abstract math concepts and some of which represent specific information that’s part of a larger story problem.


Leave a Reply