
What can calculus tell us about curve sketching? It turns out, quite a lot! In this article, you’ll see a list of the 10 key characteristics that describe a graph. While you may not be tested on your artistic ability to sketch a curve on the AP Calculus exams, you will be expected to determine these specific features of graphs.

Guide to Curve Sketching
The ten steps of curve sketching each require a specific tool. But some of the steps are closely related. In the list below, you’ll see some steps grouped if they are based on similar methods.
-
Algebra and pre-calculus
- Domain and Range
- y-Intercept
- x-Intercept(s)
- Symmetry
- Vertical Asymptote(s)
- Horizontal and/or Oblique Asymptote(s)
- Increase/Decrease
- Relative Extrema
- Concavity
- Inflection Points
Limits
First Derivative
Second Derivative
Some books outline these steps differently, sometimes combining items together. So it’s not uncommon to see “The Eight Steps for Curve Sketching,” etc.
Let’s briefly review what each term means. More details can be found at AP Calculus Exam Review: Analysis of Graphs, for example.
Step 1. Determine the Domain and Range
The domain of a function f(x) is the set of all input values (x-values) for the function.
The range of a function f(x) is the set of all output values (y-values) for the function.
Methods for finding the domain and range vary from problem to problem. Here is a good review.
Step 2. Find the y-Intercept
The y-intercept of a function f(x) is the point where the graph crosses the y-axis.
This is easy to find. Simply plug in 0. The y-intercept is: (0, f(0)).
Step 3. Find the x-Intercept(s)
An x-intercept of a function f(x) is any point where the graph crosses the x-axis.
To find the x-intercepts, solve f(x) = 0.
Step 4. Look for Symmetry
A graph can display various kinds of symmetry. Three main symmetries are especially important: even, odd, and periodic symmetry.
- Even symmetry. A function is even if its graph is symmetric by reflection over the y-axis.
- Odd symmetry. A function is odd if its graph is symmetric by 180 degree rotation around the origin.
- Periodicity. A function is periodic if an only if its values repeat regularly. That is, if there is a value p > 0 such that f(x + p) = f(x) for all x in its domain.
The algebraic test for even/odd is to plug in (-x) into the function.
- If f(-x) = f(x), then f is even.
- If f(-x) = –f(x), then f is odd.
On the AP Calculus exams, periodicity occurs only in trigonometric functions.
Step 5. Find any Vertical Asymptote(s)
A vertical asymptote for a function is a vertical line x = k showing where the function becomes unbounded.
For details, check out How do you find the Vertical Asymptotes of a Function?.
Step 6. Find Horizontal and/or Oblique Asymptote(s)
A horizontal asymptote for a function is a horizontal line that the graph of the function approaches as x approaches ∞ or -∞.
An oblique asymptote for a function is a slanted line that the function approaches as x approaches ∞ or -∞.
Both horizontal and oblique asymptotes measure the end behavior of a function. For details, see How do you find the Horizontal Asymptotes of a Function? and How do you find the Oblique Asymptotes of a Function?.
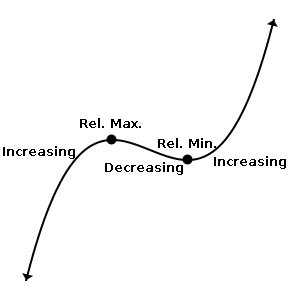
Step 7. Determine the Intervals of Increase and Decrease
A function is increasing on an interval if the graph rises as you trace it from left to right.
A function is decreasing on an interval if the graph falls as you trace it from left to right.
The first derivative measures increase/decrease in the following way:
- If f '(x) > 0 on an interval, then f is increasing on that interval.
- If f '(x) < 0 on an interval, then f is decreasing on that interval.
Step 8. Locate the Relative Extrema
The term relative extrema refers to both relative minimum and relative maximum points on a graph.
A graph has a relative maximum at x = c if f(c) > f(x) for all x in a small enough neighborhood of c.
A graph has a relative minimum at x = c if f(c) < f(x) for all x in a small enough neighborhood of c.
The relative maxima (plural of maximum) and minima (plural of minimum) are the “peaks and valleys” of the graph. There can be many relative maxima and minima in any given graph.
Relative extrema occur at points where f '(x) = 0 or f '(x) does not exist. Use the First Derivative Test to classify them.
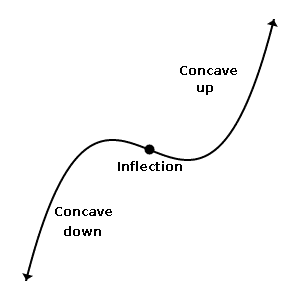
Step 9. Determine the Intervals of Concavity
Concavity is a measure of how curved the graph of the function is at various points. For example, a linear function has zero concavity at all points, because a line simply does not curve.
A graph is concave up on an interval if the tangent line falls below the curve at each point in the interval. In other words, the graph curves “upward,” away from its tangent lines.
A graph is concave down on an interval if the tangent line falls above the curve at each point in the interval. In other words, the graph curves “downward,” away from its tangent lines.
Here’s one way to remember the definitions: “Concave up looks like a cup, and concave down looks like a frown.”
The second derivative measures concavity:
- If f ''(x) > 0 on an interval, then f is concave up on that interval.
- If f ''(x) < 0 on an interval, then f is concave down on that interval.
Step 10. Locate the Inflection Points
Any point at which concavity changes (from up to down or down to up) is called a point of inflection.
Any point where f ''(x) = 0 or f ''(x) does not exist is a possible point of inflection. Look for changes in concavity to determine if these are actual points of inflection.
Final Thoughts
This short article only outlines the steps for accurate curve sketching. Now it’s up to you to familiarize yourself with the various methods and tools that will help you to analyze the graph of any function.

Leave a Reply